Proxy-based LLM observability for Support API Teams



Use proxy-based LLM observability to trace support sessions, track token costs, diagnose streaming delays and errors, and protect customer data.
Proxy-based LLM observability for Support API Teams
Would you notice if your support bot returned HTTP 200 while giving customers the wrong refund policy? That gap between API success and customer success is why proxy-based LLM observability matters: an LLM proxy gives support API teams a central place to instrument model traffic, but useful visibility requires more than counting requests.
The debate is getting attention. The research brief for this October 2026 guide highlights the Hacker News discussion “If you don’t run your own LLM proxy, how do you know whats going on?” with a reported score of 203 points—a supplied snapshot, not a verified live ranking. The underlying argument, published on jrdsgl.com, is direct: run the proxy “somewhere you control” and adapt it to your engineering needs. daily.dev’s summary identifies the practical concern: provider dashboards can lack the time-series detail needed for engineering decisions.
For customer-support developers, that concern translates into operational questions. Which model handled a disputed cancellation? Did a retry double the cost? Was the delay caused by retrieval, a tool call, the model provider, or your own gateway? A monthly token total cannot answer those questions without application-level context.
Consider a hypothetical refund assistant: the first model times out, a fallback responds, and the customer receives an answer based on outdated policy text. Your endpoint succeeds, yet the interaction contains three separate problems: provider reliability, fallback behavior, and knowledge quality. A proxy can expose the model-call sequence; it cannot establish answer correctness without additional evaluation.
What should support API teams monitor through an LLM proxy?
This guide focuses on five monitoring layers:
- Latency: track time to first token and complete responses, including tail latency rather than averages alone.
- Reliability: distinguish provider failures, rate limits, retries, fallback attempts, and interrupted streams.
- Cost: attribute token usage and spending to support workflows, tenants, and resolved issues.
- Quality: connect model traces with retrieval context, tool outcomes, policy checks, and human escalation.
- Privacy: define redaction, retention, access controls, and which customer identifiers belong in logs.
As of October 2026, CallMissed’s verified fact sheet lists 124 models behind one API key and balance, alongside usage and request logs and caller-chosen fallback models—capabilities that fit this broader gateway trend.
You’ll learn where to instrument requests, which signals deserve alerts, and how to connect traces to support outcomes without logging sensitive conversations indiscriminately. The goal is not simply owning a proxy: it is knowing what happened, why it happened, and what needs fixing.
What should an LLM proxy monitor? Tokens, latency, errors, support outcomes and privacy
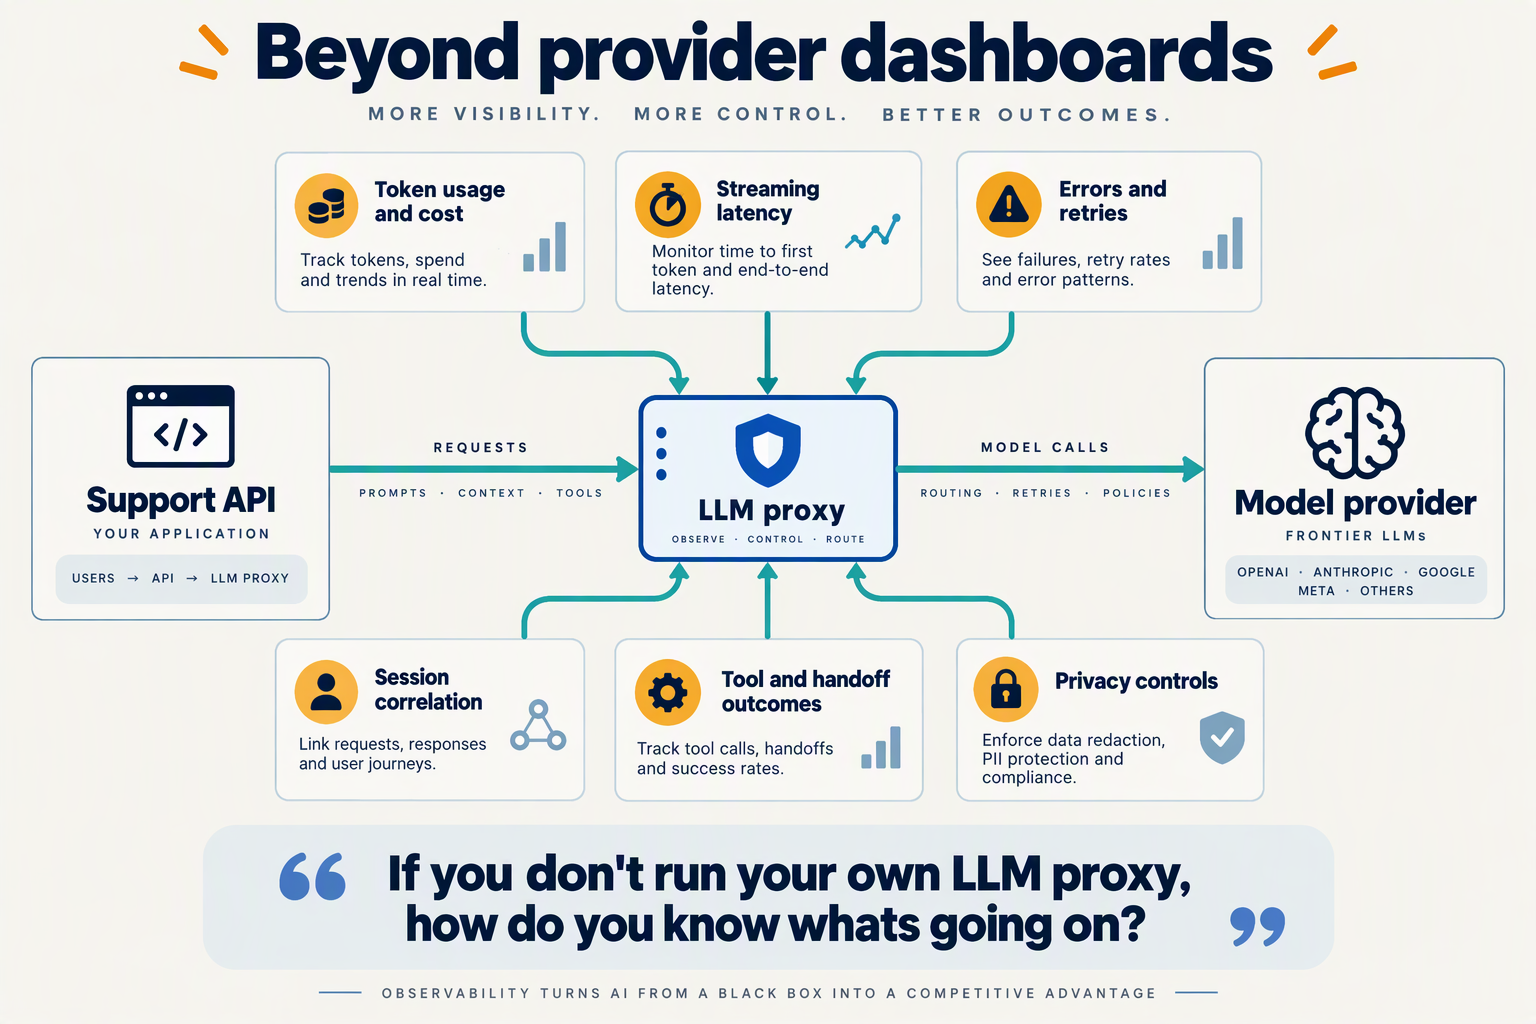
An LLM proxy should monitor each model attempt and connect those attempts to the customer-support task they serve: token consumption, latency, failures, resolution quality, and privacy exposure. The essential unit is a trace linking the customer request, retrieval steps, tool calls, retries, and final outcome—not an isolated API response.
Which token and cost metrics should an LLM proxy capture?
Record usage per attempt, then aggregate it by conversation, tenant, workflow, and resolved issue. Otherwise, retries and fallbacks can disappear inside apparently reasonable averages.
Capture these fields where the provider exposes them:
- Input and output tokens, with cached-input and reasoning-token counts separately where available.
- Requested and actual model, provider, attempt number, and routing reason.
- Estimated and reconciled cost, preserving the pricing version used for calculation.
- Prompt version and retrieval size, so growing context can be traced to a deployment or knowledge-base change.
For a hypothetical support request with three billable attempts, counting only the final response understates consumption by excluding two attempts. Keep logical-request totals and provider-attempt totals side by side.
Use cost per resolved issue alongside cost per request. Define “resolved” explicitly—for example, a closed ticket without a subsequent reopening during your chosen observation window—and report unresolved cases separately.
How should developers measure latency and errors?
Measure latency at component boundaries, not just around the whole endpoint. This makes the difference between “the assistant is slow” and “inventory lookup dominates response time” visible.
Track:
- Gateway overhead: request arrival to provider dispatch.
- Time to first token: provider dispatch to the first streamed token.
- Completion time: dispatch to the final token or terminal event.
- End-to-end time: customer request to the usable answer, including retrieval and tools.
Report p50, p95, and p99 by workflow and model. Compare similar workloads: a short order-status response should not share its only latency chart with a lengthy troubleshooting exchange.
For reliability, distinguish provider timeouts, rate limits, authentication failures, malformed structured outputs, tool errors, and interrupted streams. Record whether recovery succeeded and how many attempts it required; a successful fallback should not erase the original failure.
How do model traces connect to support outcomes?
Attach outcome events from the support application to the same trace identifier. A proxy sees model traffic; ticketing and evaluation systems supply evidence about whether that traffic helped.
Useful outcome signals include:
- Task completion: was the requested action actually confirmed by the relevant tool?
- Policy adherence: did the answer match the applicable policy version?
- Escalation and reopening: did a human intervene, or did the issue return?
- Customer feedback: what CSAT or explicit feedback followed the interaction?
Keep these signals separate. Escalation can be the correct outcome for a sensitive dispute, while a low escalation rate can conceal confidently incorrect answers.
What customer data should stay out of proxy logs?
Default to metadata-first logging, with narrowly scoped, redacted content capture when debugging requires it. Use pseudonymous conversation identifiers; restrict access, set retention periods, and test whether sensitive fields survive redaction.
The jrdsgl.com article supplied for this October 2026 guide recommends modifying a proxy “for your actual needs.” For support teams, that means shaping telemetry around business outcomes without creating an unnecessary archive of customer conversations.
As of October 2026, CallMissed’s verified fact sheet lists usage and request logs and caller-chosen fallback models in its developer API. Those capabilities can support investigation, but teams still need application-level instrumentation to connect model activity to resolution quality and privacy controls.
What prerequisites and telemetry fields do you need before setup?
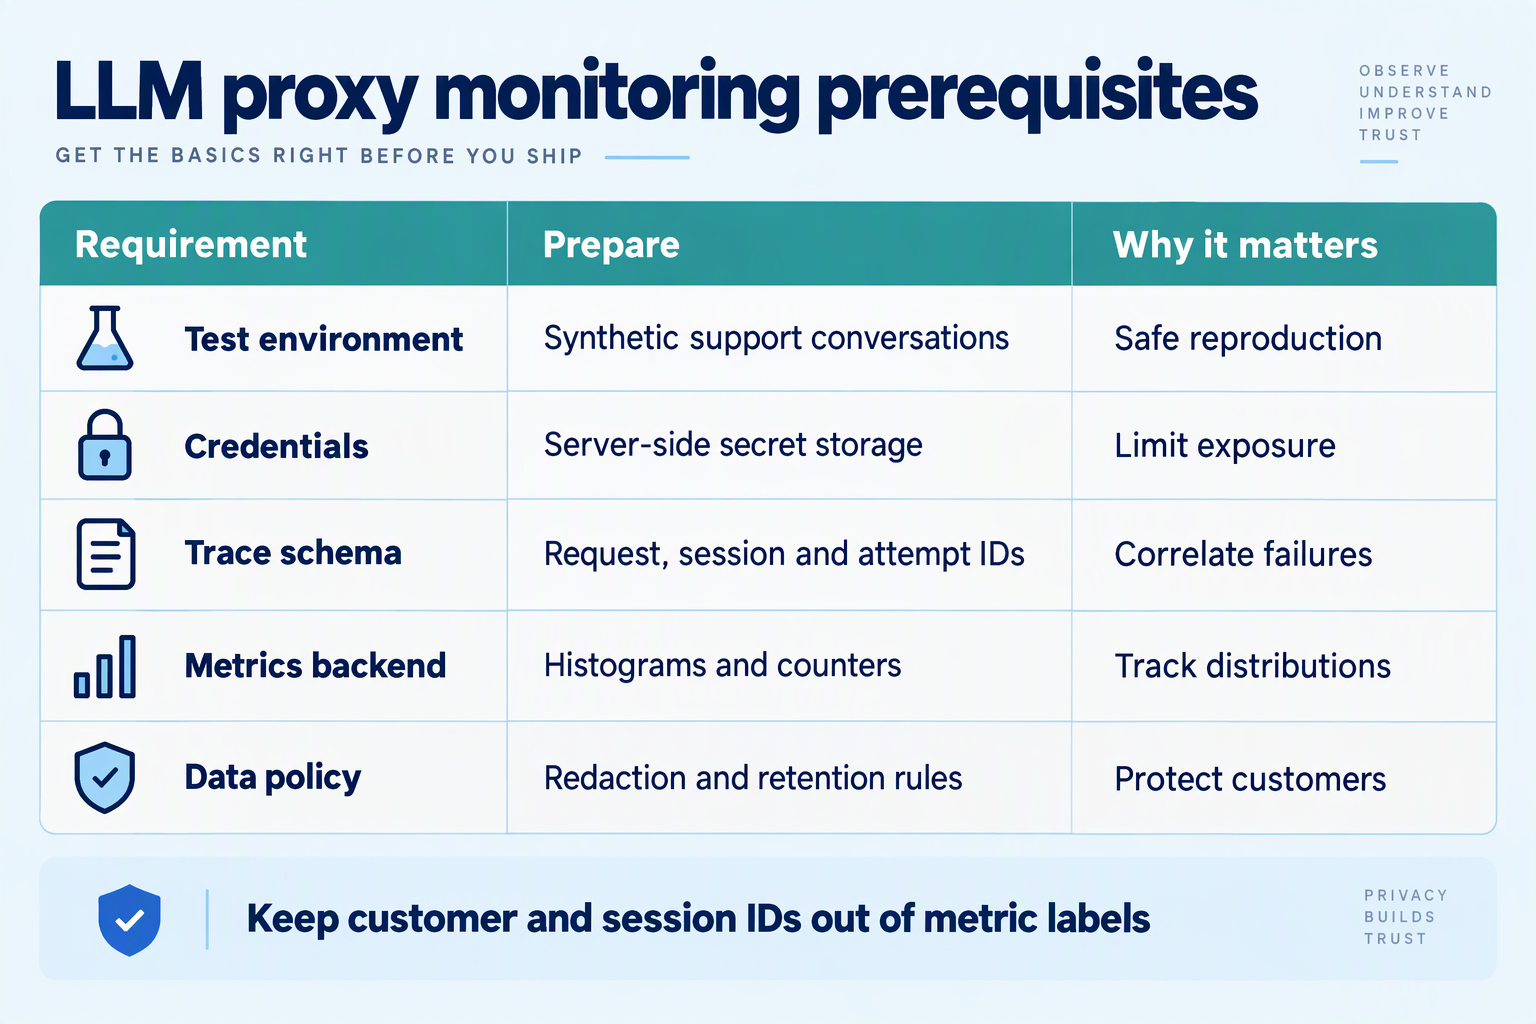
Before setting up an LLM proxy, define your request identifiers, support-workflow labels, privacy rules, and telemetry destination. Your minimum schema should connect each customer interaction to its individual model attempts without requiring raw conversation text in every log.
What infrastructure prerequisites should you establish first?
Start with an instrumentation contract, not a dashboard. The daily.dev summary supplied for this October 2026 guide identifies insufficient time-series detail in provider dashboards as a practical concern; your setup should therefore preserve timestamped events that engineers can query independently.
Agree on these prerequisites before routing production traffic:
- Map the request path: identify the support API, retrieval service, tool executor, proxy, and upstream model provider. Decide which component records each event so overlapping measurements are not accidentally added together.
- Choose a correlation standard: propagate trace context using W3C Trace Context where supported, and preserve a separate application request identifier across retries.
- Provision the telemetry destination: select a trace collector, structured-log store, and metrics backend. Assign ownership for ingestion failures, access permissions, and retention.
- Define the privacy boundary: specify prohibited fields, redaction behavior, and whether any restricted diagnostic store may retain conversation content.
- Document operating limits: record provider quotas, request timeouts, retry budgets, and supported streaming behavior. Keep provider credentials in a secrets manager, outside telemetry.
Which telemetry fields belong in the initial schema?
The following is a recommended October 2026 implementation checklist, not a claim that every gateway exposes these fields automatically. Capture unavailable fields in your application wrapper or mark them explicitly as unknown.
| Field group | Minimum fields | Capture point | Support debugging value |
|---|---|---|---|
| Correlation | trace_id, request_id, attempt_id, parent_span_id | Application and proxy | Reconstructs retries and fallback chains |
| Workflow context | tenant_ref, workflow, channel, prompt_version, kb_version | Support application | Identifies affected workflows and policy revisions |
| Routing | requested_model, actual_model, provider, fallback_reason | Proxy | Shows which model actually answered |
| Timing | started_at, ttft_ms, duration_ms, stream_completed | Proxy and stream consumer | Separates slow starts from interrupted delivery |
| Usage and cost | input_tokens, output_tokens, cached_tokens, cost_estimate, price_version | Provider response and billing logic | Attributes usage without treating estimates as invoices |
| Result and outcome | http_status, error_class, retry_count, tool_status, handoff_reason | Proxy and application | Connects transport failures with support handling |
Keep one record per model attempt and a parent record for the overall support request. Otherwise, a successful fallback can hide the original timeout or make two billable attempts look like one.
How should you validate the schema before production?
Use a synthetic refund enquiry to exercise three paths: a normal answer, a forced timeout followed by fallback, and a stream interrupted before completion. Confirm that engineers can reconstruct the sequence without accessing the customer’s message.
Apply two guardrails:
- Control metric cardinality: use bounded labels such as workflow and provider in metrics; keep request identifiers in traces or logs.
- Distinguish missing from zero: unavailable token usage is not zero usage, and estimated cost is not settled billing.
As of October 2026, CallMissed’s verified fact sheet lists OpenAI-compatible and Anthropic-compatible endpoints, plus usage and request logs. Those capabilities provide integration points, but developers should verify log-field coverage and add support-specific context in their own application instrumentation.
How do you route your first request and connect it to a support session?
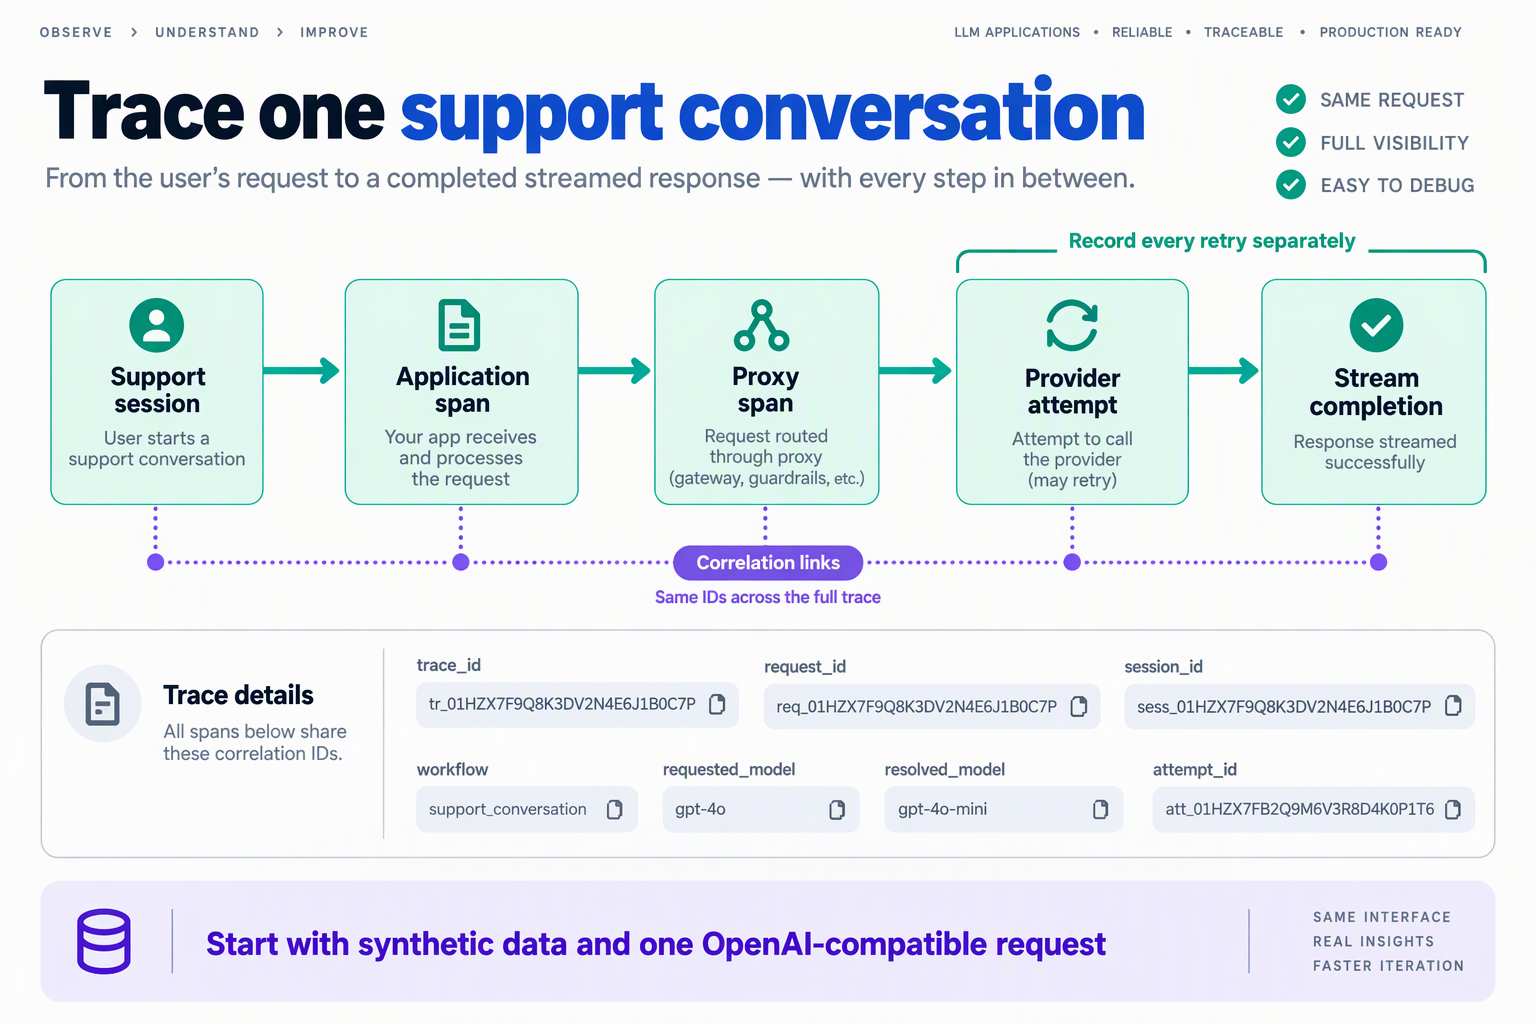
Route your first request from the support backend through the LLM proxy, then attach application-generated identifiers that connect the model call to its support session. Keep session correlation in your own telemetry, rather than assuming a provider dashboard—or a forwarded custom header—will preserve that relationship.
How do you send an OpenAI-compatible request through a proxy?
Start with one test workflow, such as drafting a refund-policy response. Keep the prompt and model configuration unchanged while switching the network route; this makes routing failures easier to isolate.
- Configure the endpoint: point your server-side OpenAI SDK at the proxy’s documented API base URL.
- Configure authentication: use the credential expected by that proxy, stored in your secrets manager.
- Select a supported model: use the proxy’s documented model identifier, not an assumed provider alias.
- Send a synthetic request: use fictional customer details and a known policy excerpt.
- Verify the route: confirm that both your application trace and the proxy’s request record show the attempt.
A minimal Python routing example looks like this:
import os
from openai import OpenAI

client = OpenAI(
    base_url=os.environ["LLM_PROXY_BASE_URL"],
    api_key=os.environ["LLM_PROXY_API_KEY"],
)

response = client.chat.completions.create(
    model=os.environ["LLM_MODEL"],
    messages=[
        {"role": "system", "content": "Answer using the supplied policy."},
        {"role": "user", "content": "Test policy: refunds within 14 days. "
                                    "Is a purchase from 7 days ago eligible?"},
    ],
)
As of October 2026, CallMissed’s verified fact sheet documents OpenAI-compatible chat-completions endpoints, allowing existing SDK integrations to switch by changing the base URL. That simplifies connectivity; support-session instrumentation remains a separate application responsibility.
Which identifiers connect an LLM request to a support session?
Use distinct identifiers for distinct relationships. A support session can contain several customer turns, and each turn can trigger retrieval, tools, and multiple model attempts.
support_session_id: an opaque reference to the conversation.turn_id: the particular customer interaction being handled.trace_id: the end-to-end execution, including retrieval and tools.attempt_id: one outbound model attempt, including retries.tenant_id: an internal account reference for attribution and access control.
Generate these values in the trusted backend. Validate tenant ownership before accepting any client-supplied session reference, and avoid email addresses, phone numbers, or ticket text as identifiers.
Use W3C Trace Context where supported between your services. If the proxy accepts custom metadata, follow its documented schema and verify persistence; do not assume arbitrary headers appear in logs or reach providers.
How do you prove the session linkage works?
For the synthetic refund request, emit an application-owned event containing the identifiers above, requested model, timestamps, outcome, and any provider or gateway request identifier actually returned. Record the actual serving model only when the response or proxy telemetry exposes it.
Then run three checks:
- Search by session ID and locate the correct turn and model attempt.
- Trigger a controlled failure and confirm each retry receives a separate attempt ID.
- Confirm an authorized engineer can follow the request without opening raw customer messages.
The jrdsgl.com article supplied for this October 2026 guide recommends adapting a proxy “for your actual needs.” For support developers, the first adaptation should be reliable session correlation: a successful API response is useful only when you can identify which customer interaction it served.
How do you track tokens and cost by request, customer and support workflow?
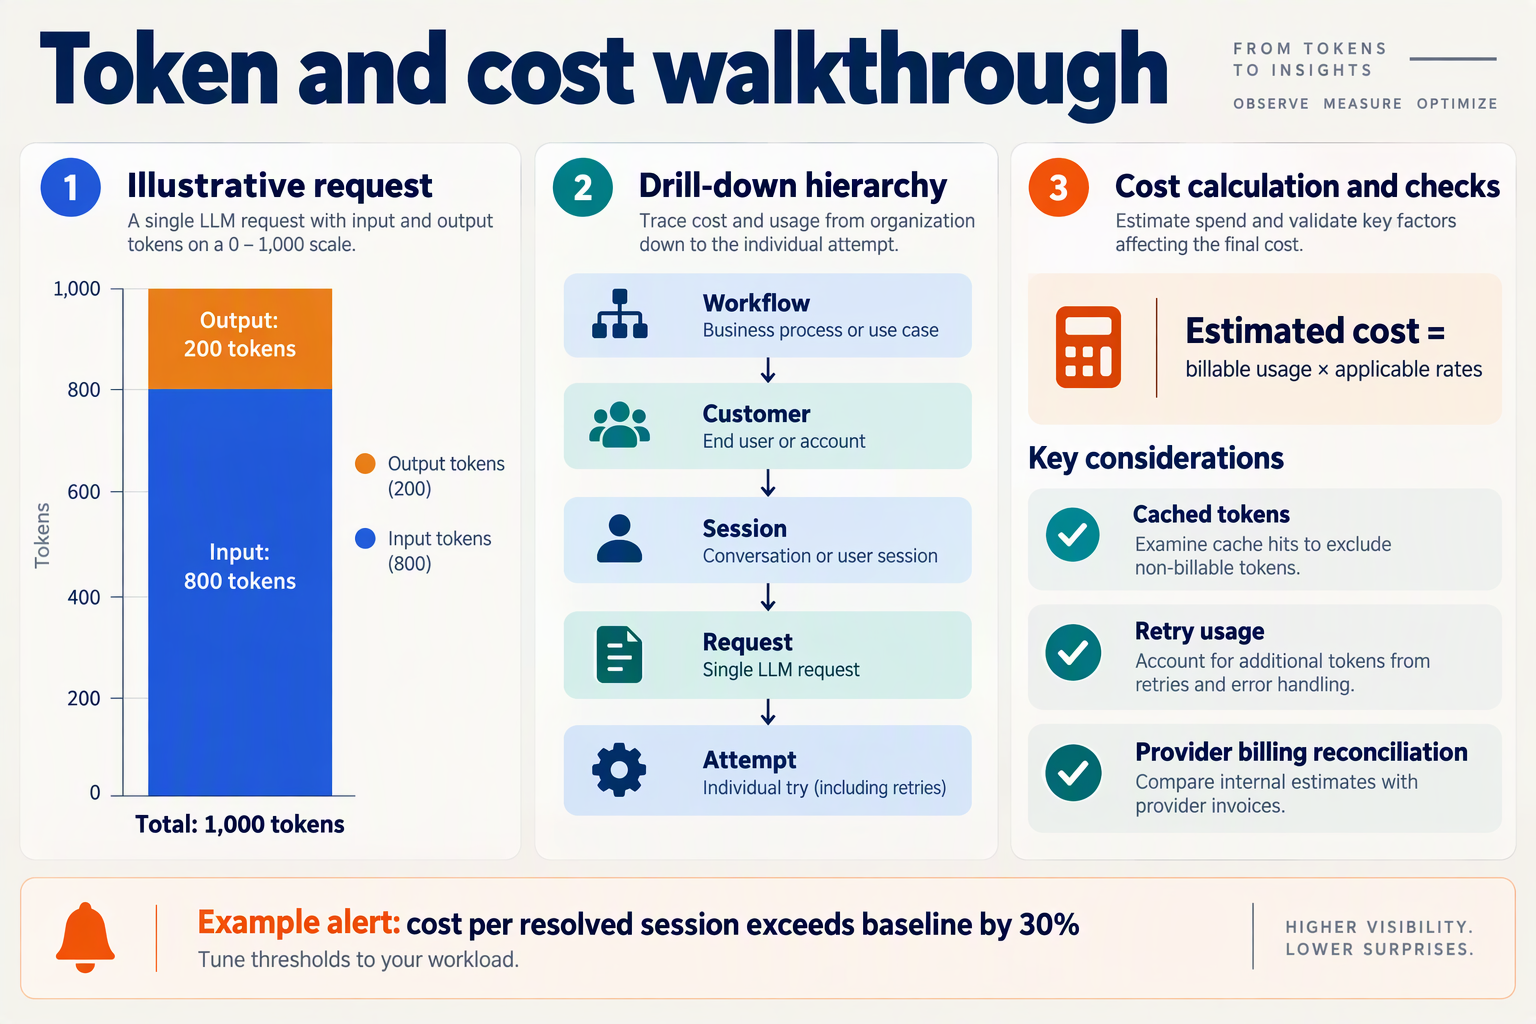
Track provider-reported token usage for every model attempt, calculate its cost using a versioned rate card, and attach application-owned customer and workflow identifiers. Aggregate those records into request cost, customer spend, and cost per resolved support issue—not just a monthly token total.
daily.dev’s summary in the research supplied for this October 2026 guide identifies the limitation: provider dashboards can lack the time-series detail needed for engineering decisions. Your proxy’s accounting should connect those usage figures to the support work that generated them.
What should you record for each LLM request?
Keep an attempt-level usage ledger, with each attempt linked to the logical API request and support workflow:
- Identity:
request_id,attempt_id,workflow_id, and a pseudonymoustenant_idor customer identifier. - Purpose: workflow type, such as refund eligibility, order lookup, ticket summarization, or reply drafting.
- Execution: provider, returned model identifier, timestamp, and whether the attempt was a retry or fallback.
- Usage: input, output, and provider-specific cached or reasoning-token fields.
- Accounting: billing currency, rate-card version, calculated cost, and whether usage is reported, estimated, or unavailable.
Use structured metadata rather than extracting customer identity from conversation text. Keep high-cardinality identifiers in the ledger or trace store; use bounded labels such as workflow and model for monitoring metrics.
Missing usage is not zero usage. If a stream disconnects before final usage arrives, flag the amount as unknown or estimated and reconcile it later where provider records permit.
How do you calculate token cost without double-counting?
For a model with separate input and output rates:
Attempt cost = input tokens × input rate + output tokens × output rate, with rates converted from their published billing units.
Treat cached-input and reasoning fields according to that provider’s billing semantics. A cached-token field may describe a subset of input tokens, while reasoning tokens may already be included in output usage; blindly adding every field can inflate your ledger.
Here is a hypothetical October 2026 budgeting example, not a quoted provider price:
- Assume input costs $2 per million tokens and output costs $8 per million tokens.
- An attempt using 4,000 input tokens and 500 output tokens costs $0.012.
- Two equally sized, billable attempts cost $0.024, even if the application returns only one answer.
Sum billable attempts under the parent request. Track retrieval, search, and other paid tools separately so token cost and total workflow cost remain distinguishable. Reconcile ledger totals against billing records, documenting differences such as rounding, credits, and currency conversion.
Which customer-support cost metrics should trigger investigation?
Build views by customer, workflow, model, and time window, then monitor:
- Cost per workflow: median and tail spending, exposing expensive outliers.
- Cost per resolved issue: total attributable spend divided by resolved issues in a defined cohort.
- Retry and fallback spend: money spent beyond the initial attempt.
- Context growth: input-token increases caused by longer histories or retrieved documents.
In a hypothetical October 2026 cohort, $3 spent across 100 workflows with 75 resolved issues equals $0.04 per resolved issue, versus $0.03 per workflow. Define “resolved” and the reopening window before comparing results.
Investigate sudden changes against each workflow’s baseline. A cheaper model call is not a saving if repeated attempts or reopened tickets increase the cost of actually helping the customer.
How do you diagnose streaming latency, provider errors and proxy overhead?
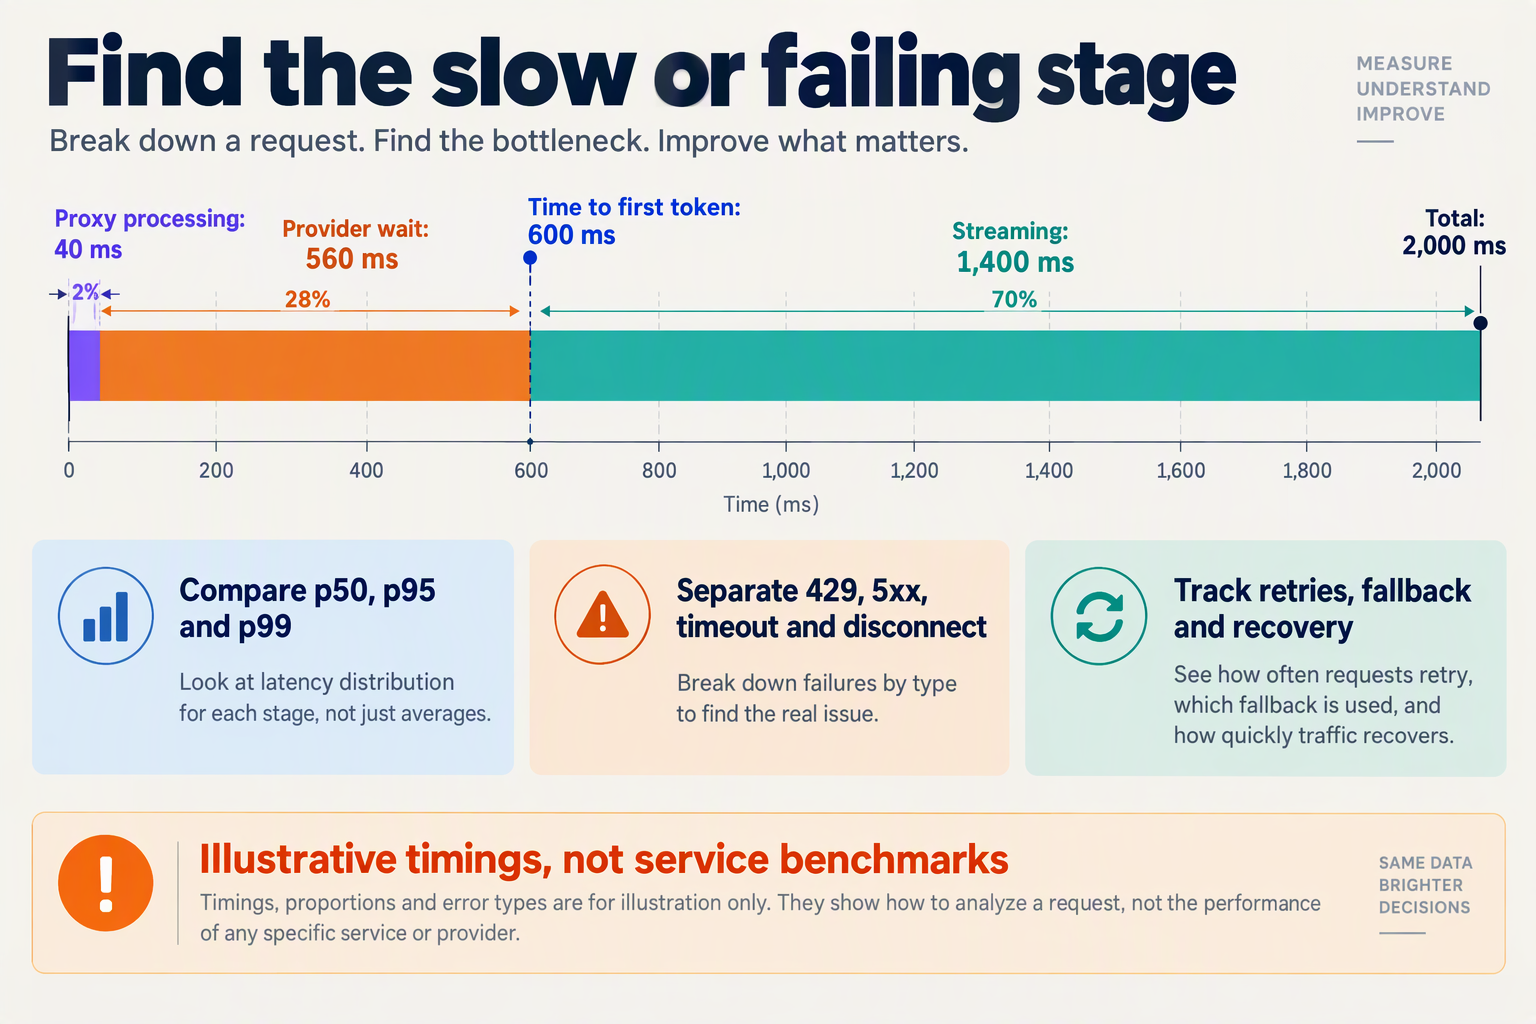
Diagnose streaming latency, provider errors, and proxy overhead by tracing each upstream attempt and the downstream stream separately. Measure when the request enters the proxy, when the provider produces content, and when that content reaches the client—not just when HTTP headers arrive.
How do you measure streaming latency correctly?
Instrument these boundaries with a monotonic clock for durations inside each process; use distributed tracing to connect proxy and application spans:
- Request accepted: the proxy receives the request.
- Upstream dispatch: authentication, routing, and any queueing finish.
- First upstream content: the provider returns the first answer-bearing chunk.
- First downstream content: the proxy forwards that content.
- Stream completion: the expected completion signal arrives, or the connection terminates unexpectedly.
Time to first token (TTFT) should exclude empty chunks, role metadata, and keepalive events. If reasoning-capable models emit internal reasoning before answer text, record separate first-output and first-answer timestamps. A chunk may contain multiple tokens, so label chunk-based measurements honestly.
Track inter-chunk gaps, total stream duration, and completion status alongside TTFT. Headers arriving quickly do not guarantee that a customer sees an answer quickly; buffering can leave the support interface blank while the upstream stream is already active.
Break these measurements down by provider, model, region, workflow, and streaming mode. Compare p50, p95, and p99 within comparable traffic groups rather than blending short classification requests with long policy explanations.
How do you distinguish provider errors from proxy failures?
Create one parent trace for the support request and a separate child span for every provider attempt. Record the upstream status independently from the downstream response: once streaming headers have been sent, a later provider failure may not change the customer-facing HTTP status.
Use explicit failure categories:
- Rate limiting: record upstream HTTP 429 responses and any
Retry-Afterguidance. - Provider failure: separate upstream 5xx responses from errors generated by your proxy.
- Transport failure: distinguish DNS, TLS, connection, and read timeouts.
- Stream failure: detect malformed events, unexpected termination, and missing protocol-specific completion signals.
- Client cancellation: identify customer disconnects separately from upstream failures.
Log attempt number, timeout settings, backoff duration, fallback destination, and final outcome. Keep request identifiers in traces or logs, not high-cardinality metric labels.
Retrying after partial output risks duplicated or contradictory answers. Define whether your application restarts, resumes where supported, or escalates—and test that behavior explicitly.
How do you isolate proxy overhead without misleading yourself?
Measure queueing, routing, request transformation, and chunk-forwarding delays directly. Do not subtract provider p95 latency from end-to-end p95 latency: those percentiles may describe different requests.
In a hypothetical October 2026 diagnostic trace, upstream content arrives at 900 milliseconds, but downstream content is forwarded at 1,150 milliseconds. That trace identifies a 250-millisecond forwarding delay to investigate; it does not establish a provider performance benchmark.
Run matched direct-provider and proxied tests with the same model, payload, region, concurrency, and connection-reuse settings. Inspect buffering, synchronous logging, CPU saturation, and connection-pool contention before blaming model generation.
The daily.dev summary supplied for this October 2026 guide identifies missing time-series detail in provider dashboards as an engineering concern. The practical response is a dashboard that connects latency spikes to specific attempts and stream boundaries, backed by alerts for sustained tail-latency increases and incomplete streams—not averages alone.
How can you log support conversations without exposing customer data?
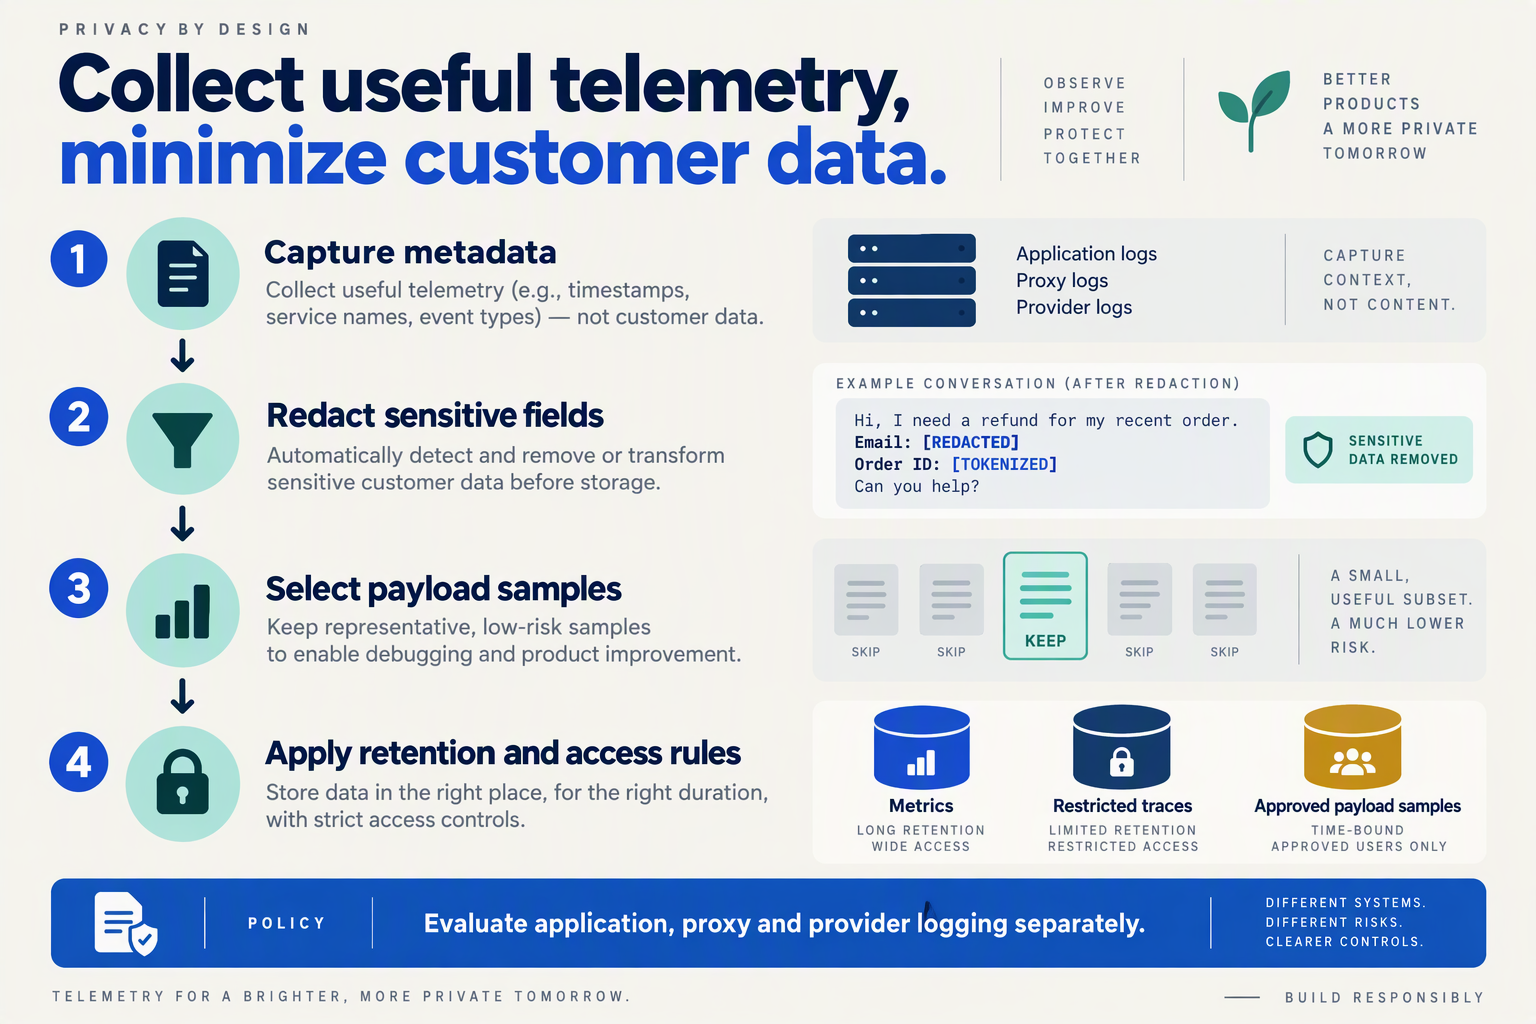
Log structured operational metadata by default, and retain conversation content only when a defined debugging or quality-review purpose requires it. Redact sensitive fields before telemetry export, restrict access to any retained transcripts, and enforce deletion across every copy—not just your primary log store.
The jrdsgl.com essay supplied for this October 2026 guide recommends running a proxy “somewhere you control.” For customer-support teams, that control should include what never enters the logs, not merely where logs are hosted.
What should an LLM proxy log instead of raw conversations?
Separate operational traces from content evidence. Most reliability investigations need the sequence of events, not a customer’s address or full complaint.
A useful metadata-only event can contain:
- Correlation: a randomly generated trace ID, model-attempt ID, and pseudonymous conversation reference.
- Execution: provider, model, prompt-template version, retrieval-document identifiers, and tool name.
- Performance: timestamps, latency, token counts, retry count, and normalized error category.
- Outcome: policy-check result, escalation status, and tool success or failure.
Avoid putting customer messages into error labels or attaching entire request bodies to exceptions. Also keep conversation identifiers out of metrics labels: they create high cardinality and unnecessary customer-level exposure.
For a hypothetical refund dispute, log policy_version=refund_v3, tool=lookup_order, and result=eligible. Keep the customer’s email, shipping address, and order details in the authorized support system rather than duplicating them in observability storage.
Where should you redact sensitive customer data?
Redact before the first telemetry destination, including application logs, tracing collectors, error trackers, and proxy access logs. A dashboard filter hides data from view; it does not remove the stored original.
Use a layered implementation:
- Allowlist fields. Export approved metadata rather than serializing complete request objects.
- Remove known secrets. Strip authorization headers, API keys, cookies, payment credentials, and sensitive tool arguments.
- Inspect unstructured text. Combine pattern matching with entity detection for names, addresses, and identifiers; test regional formats and code-mixed messages.
- Recheck outputs and failures. Model responses, retrieved documents, and exception messages can repeat sensitive inputs.
Redaction has limits: a detailed complaint may identify someone even after names disappear. Pseudonymization is not anonymization. Where stable correlation is necessary, consider tenant-scoped keyed identifiers instead of plain hashes of predictable values such as email addresses.
Redacting telemetry also does not stop the model provider receiving the original prompt. Provider-bound payloads need a separate minimization review.
How should teams retain and access conversation evidence?
Create a separate, restricted evidence store for approved transcript samples. Give each sample a purpose, owner, expiry, and access trail; do not make raw-content capture the default troubleshooting switch.
Define retention by data class: operational metadata, redacted excerpts, and exceptional raw evidence need not share one lifetime. Trace deletion through search indexes, exports, caches, and backup policies, and document any restoration-related limits.
As of October 2026, CallMissed’s verified fact sheet lists usage and request logs for its developer AI API. Those capabilities belong in your logging inventory, but do not establish redaction, retention, or access-control guarantees; verify those requirements separately.
Finally, test privacy controls with synthetic support messages containing fake secrets and identifiers. The acceptance criterion is concrete: engineers can explain the failed interaction, while prohibited customer data never appears in exported telemetry.
Which advanced checks compare proxy-based monitoring with SDK instrumentation?
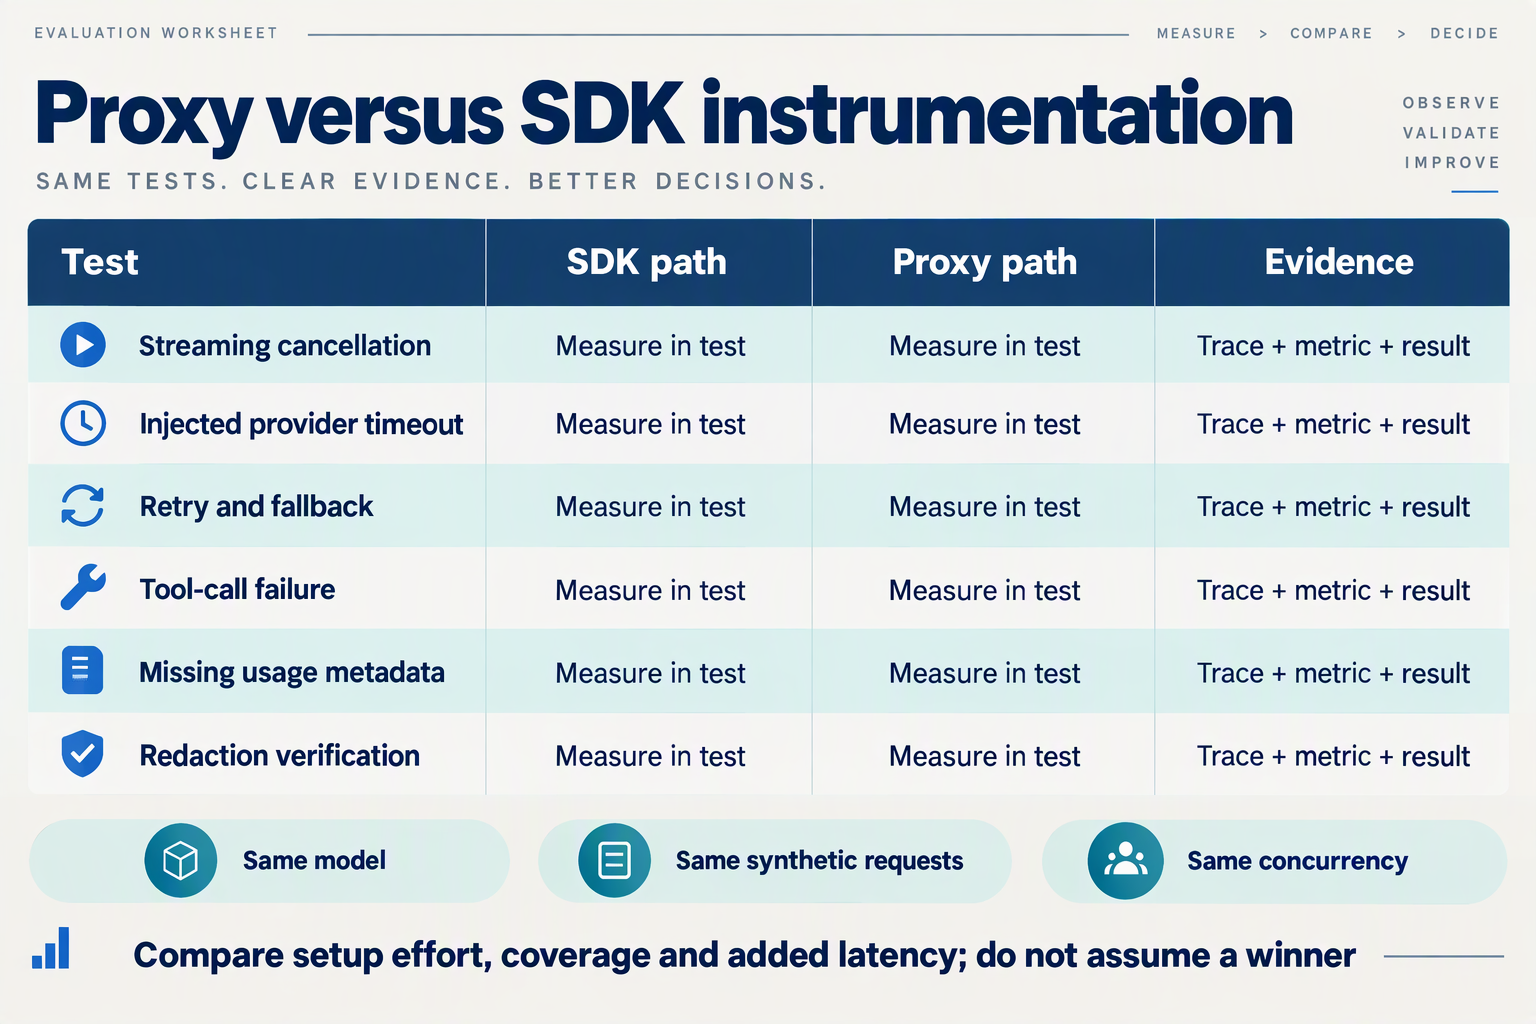
Compare proxy-based monitoring with SDK instrumentation by testing whether both reconstruct the same support interaction under failure—not merely whether both record a successful request. A proxy observes traffic routed through it; application-side SDK instrumentation can add retrieval, tool execution, and customer-delivery context, depending on what you instrument.
Which advanced checks reveal gaps between proxy and SDK telemetry?
Use the following October 2026 validation checklist as a test plan, not a product benchmark. Run each scenario with synthetic customer data and correlate records using a shared interaction ID plus separate model-attempt IDs.
| Advanced check | Proxy-side evidence | SDK/application evidence | Passing condition |
|---|---|---|---|
| Nested retries | Provider attempts, statuses, routing decisions | SDK retry events and outer application retries | Every attempt maps to one interaction; none disappear or count twice |
| Stream cancellation | Upstream stream closure and reported usage | Customer disconnect, cancellation signal, delivered chunks | Distinguish generated output from output actually delivered |
| Tool-call completion | Model’s tool request and subsequent model calls | Tool execution, result, timeout, authorization outcome | Trace separates “tool requested” from “tool succeeded” |
| Cache behavior | Gateway cache hit or upstream request | Application cache hit and response provenance | Identify the serving cache layer and exclude hits from provider-attempt counts |
| Traffic bypass | Requests received at the gateway | Outbound model calls across workers and services | Every expected call reaches the proxy, or has an explicit exception |
| Redaction and sampling | Stored gateway fields and retained attempts | Pre-send redaction and retained application spans | Sensitive test markers stay out of logs; sampling gaps remain identifiable |
Neither layer is automatically complete. For example, a proxy cannot observe an application-cache hit that prevents a network request, while an SDK wrapper may miss a background worker using a different HTTP client.
How should developers validate trace completeness?
Build a small, deterministic test suite before trusting production dashboards:
- Inject a provider failure. Trigger an SDK retry followed by a gateway fallback. Check that the logical interaction has distinct attempt records rather than one misleading success.
- Disconnect during streaming. Record when the customer connection closes, when cancellation propagates, and when upstream generation stops. Do not assume those events occur simultaneously.
- Fail a support tool. Return a synthetic authorization error from a refund tool. Confirm that the trace cannot mistake the model’s tool-call request for an executed refund.
A useful derived metric is attempt reconciliation coverage: matched proxy attempts divided by application-observed attempts expected to traverse the proxy. Investigate unmatched records before setting an alert threshold; asynchronous delivery, sampling, and clock differences can create apparent discrepancies.
Where do managed gateways fit into this comparison?
As of October 2026, CallMissed’s verified fact sheet lists OpenAI-compatible and Anthropic-compatible endpoints, streaming, caller-chosen fallback models, and usage and request logs. These capabilities provide gateway-side evidence to compare with application instrumentation; the fact sheet does not establish automatic end-to-end trace correlation.
The jrdsgl.com article supplied for this October 2026 guide advises developers to “modify it for your actual needs.” For customer-support APIs, the practical interpretation is to verify observability against your workflow—not just the gateway’s dashboard.
- Keep gateway telemetry for routing and upstream-attempt evidence.
- Keep application spans for retrieval, tool outcomes, and customer delivery.
- Reconcile both before attributing a failure, cost, or successful resolution.
The strongest monitoring design is therefore layered and testable, rather than proxy-only or SDK-only.
Which monitoring mistakes hide support failures or create new risks?
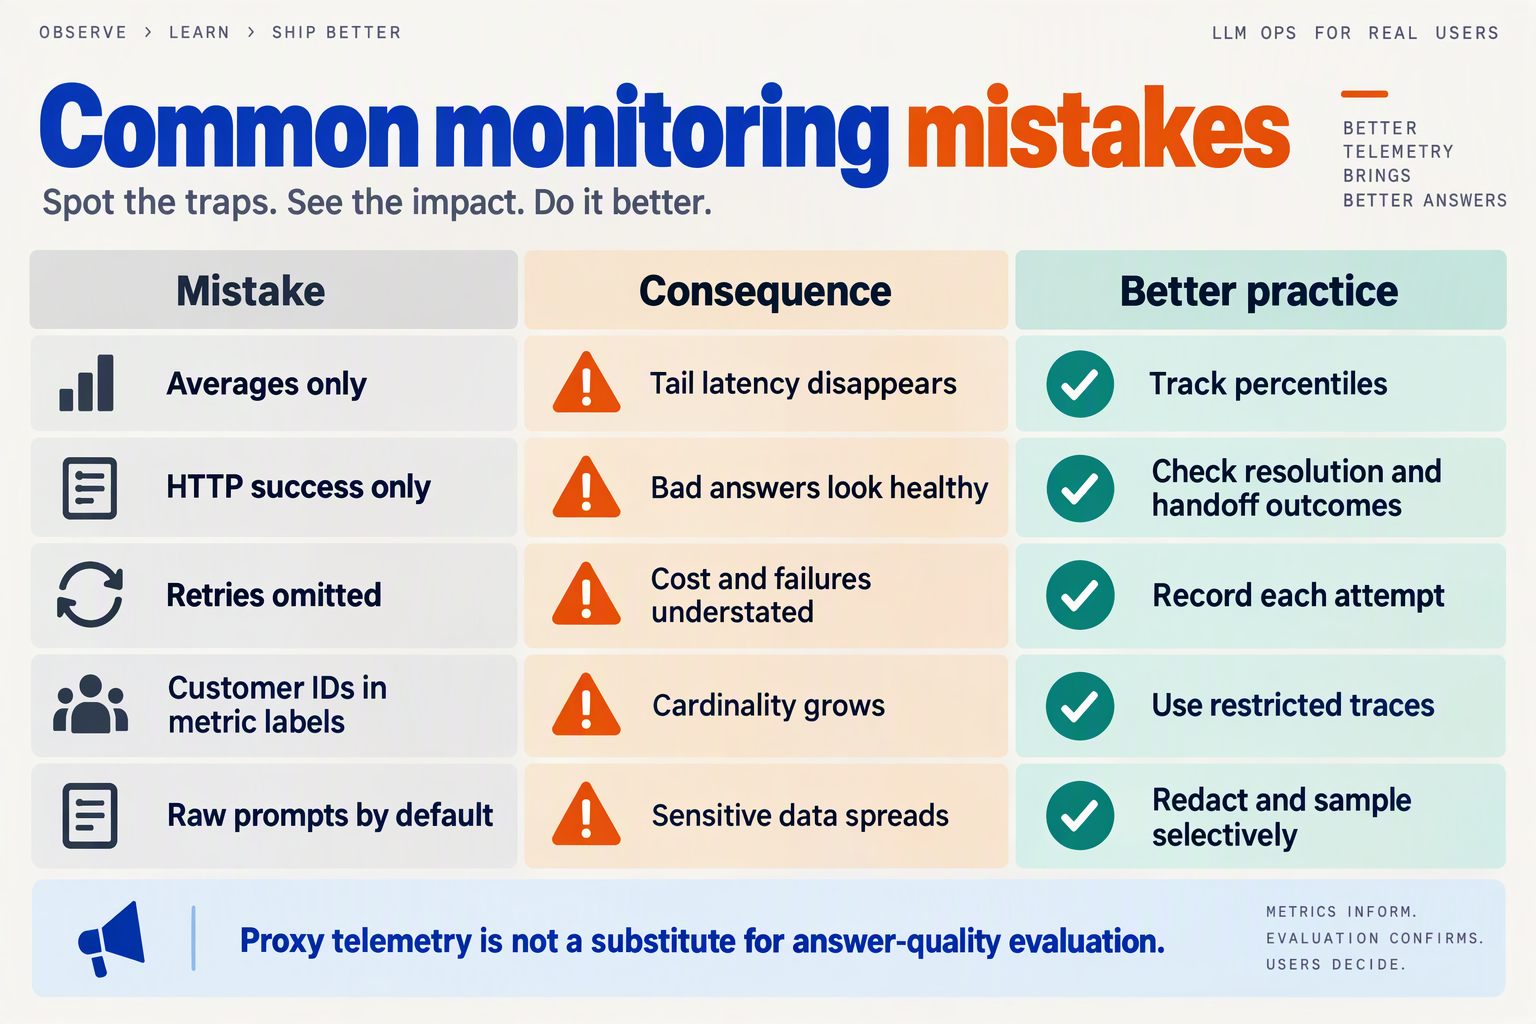
The most dangerous LLM proxy monitoring mistakes are treating successful requests as successful support, collecting misleading samples, and turning telemetry into a new failure or data-exposure path. Avoid these mistakes by testing what your monitoring misses—not just checking whether dashboards populate.
The jrdsgl.com article supplied for this October 2026 guide recommends running a proxy “somewhere you control” and modifying it for your needs. That control is useful, but it also makes your team responsible for the reliability and safety of the monitoring layer.
Which LLM observability mistakes should you fix first?
| Monitoring mistake | Hidden failure or risk | Corrective action | Verification test |
|---|---|---|---|
| Counting only HTTP status codes | A completed response can contain an incorrect policy answer | Record transport status separately from evaluated support outcomes | Submit a known policy-conflict case |
| Sampling only completed requests | Timeouts, abandoned streams, and disconnected customers disappear | Capture terminal events for every attempt; sample content separately | Disconnect a client mid-stream |
| Labeling metrics with customer IDs or full prompts | High-cardinality metrics become expensive; sensitive data spreads | Use bounded labels; keep restricted identifiers in traces | Inspect exported metric labels |
| Treating every retry as harmless | Replayed tool calls can duplicate refunds or ticket updates | Link attempts and enforce idempotency for side-effecting operations | Simulate a timeout after a tool succeeds |
| Making telemetry export synchronous | A slow logging service delays customer responses | Use bounded asynchronous queues and explicit overflow handling | Disable the telemetry destination |
| Combining results across prompt and retrieval versions | An aggregate dashboard can conceal a regression | Segment evaluations by deployed configuration and workflow | Compare releases on the same test cases |
These are engineering checks, not claims that a particular gateway automatically provides every safeguard. As of October 2026, CallMissed’s verified fact sheet lists usage and request logs alongside caller-chosen fallback models; support teams should still verify what their application records about tool effects, interrupted streams, and answer quality.
How can monitoring create a second production incident?
Unbounded collection is a common trap. Putting conversation IDs, email addresses, or raw questions into metric labels creates a new label combination for each distinct value. Keep metrics focused on bounded dimensions such as workflow, provider, model, and outcome category; use access-controlled traces for investigation.
Telemetry also needs backpressure. If your exporter slows down, a queue without a size limit can consume application memory. Decide explicitly whether overload drops diagnostic events, blocks an operation, or triggers a separate durable audit path.
- Measure telemetry health: queue depth, export failures, dropped events, and collection gaps.
- Separate diagnostic logs from audit records: a debugging sample should not be the sole record of a refund action.
- Redact before export: downstream dashboards should not receive credentials or unnecessary customer details.
How do you prove your monitoring catches support failures?
Run controlled failure drills rather than waiting for real complaints:
- Inject an ambiguous timeout. Let a mock refund tool succeed, then interrupt its response. Confirm the retry does not issue a second refund.
- Interrupt a streamed answer. Check that the interaction becomes incomplete, not successful merely because headers were sent.
- Break the exporter. Verify customer requests remain within your chosen service targets and missing telemetry becomes visible.
- Deploy a deliberately flawed policy fixture. Confirm quality checks identify the error even when transport metrics remain healthy.
As daily.dev’s summary in the October 2026 research context notes, provider dashboards can lack the time-series detail needed for engineering decisions. Your proxy should close that visibility gap—not replace it with cleaner-looking numbers that still hide failed support.
Frequently Asked Questions
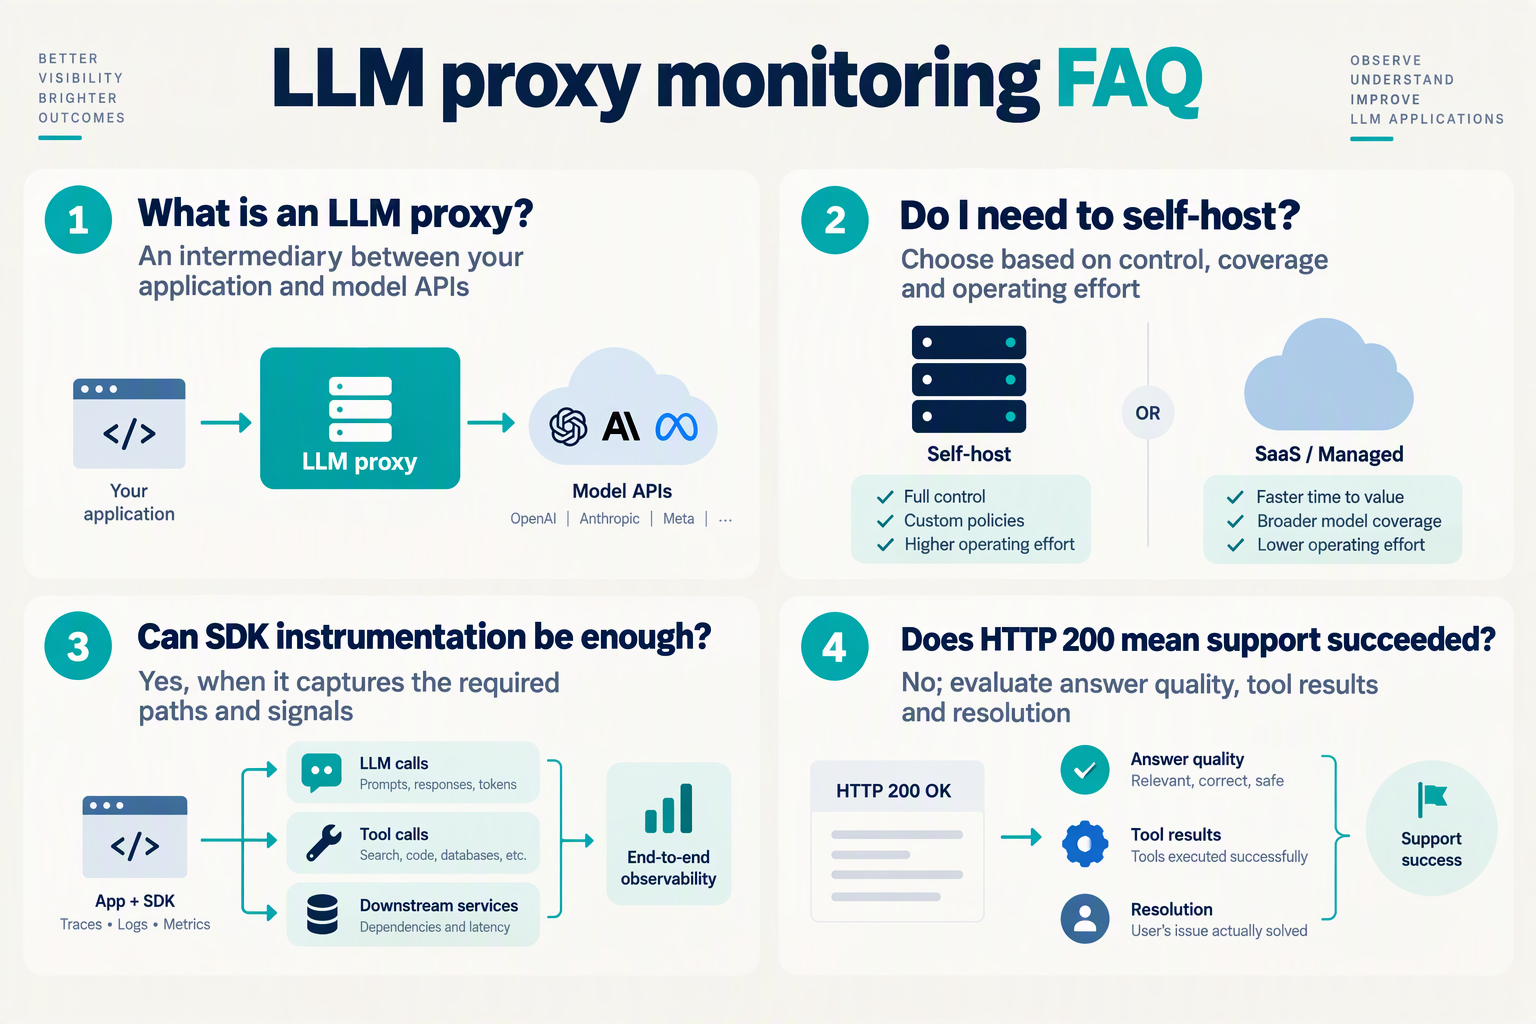
What is an LLM proxy for customer-support APIs?
Do I need to run my own LLM proxy?
Can provider dashboards replace LLM proxy monitoring?
How can support teams monitor model traffic without storing customer conversations?
Can a managed AI gateway work with existing OpenAI SDK integrations?
How should developers test a gateway before putting it into production?
What resources help you validate the setup and evaluate CallMissed as an API option?
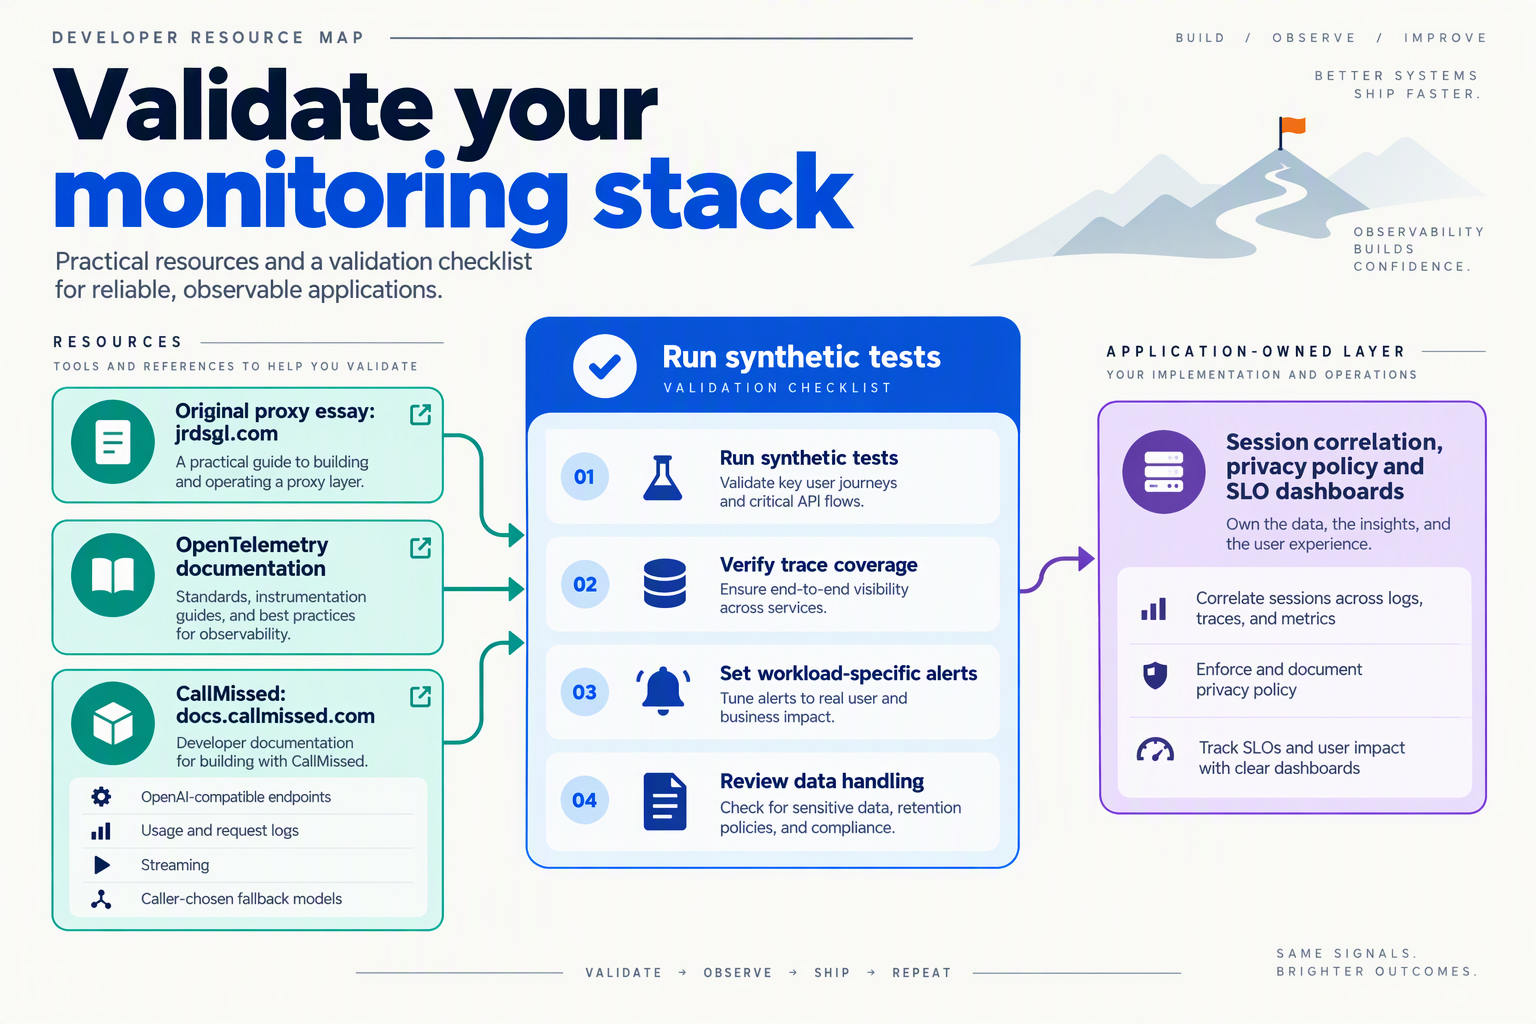
Use primary API documentation, a reproducible acceptance-test suite, and an evidence checklist to validate your LLM proxy setup. To evaluate CallMissed as an API option, test its documented compatibility and logging capabilities against your support workflow—not just whether a sample request succeeds.
Which resources should you trust when choosing an LLM proxy?
Start with implementation documentation; use explainers and comparison articles to identify questions worth testing.
- Provider API references: Check request formats, streaming events, tool-call structures, error responses, and usage fields for every endpoint your application uses.
- Proxy documentation and configuration examples: Establish which component owns retries, credentials, routing, and timeouts. Save the configuration alongside your test results.
- Architecture explainers: First Pier’s LLM proxy glossary, included in the October 2026 research brief, describes provider selection and fallback responsibilities. Use that framing to map responsibilities across your application, proxy, and upstream providers.
- Comparison articles: The supplied Fastrouter and LLM Gateway articles offer tool-selection perspectives, but both come from gateway-related publishers. Treat rankings as evaluation inputs, not independent benchmark results.
The jrdsgl.com article included in the October 2026 brief recommends that developers “modify it for your actual needs.” The practical takeaway is testability and control: whichever deployment model you choose, you need evidence that the integration supports your requirements.
How can you validate the setup before production?
Create a small, version-controlled acceptance pack using synthetic support conversations. Each case should contain an input, expected behavior, observed result, and trace reference.
- Test endpoint compatibility. Run your existing SDK against the candidate endpoint. Exercise streaming, structured responses, and tool calls separately; one successful chat completion does not validate every API surface.
- Introduce controlled failures. Simulate a timeout, rate-limit response, and disconnected stream. Record whether your application retries, selects a fallback, or returns a recoverable error.
- Reconcile one complete workflow. Follow a synthetic ticket from application request through model attempts to the final answer. Check whether the evidence explains the outcome without relying on raw customer data.
- Repeat after configuration changes. Re-run the same fixtures when changing models, prompts, SDK versions, or routing rules. Preserve results so regressions are visible.
For example, a synthetic address-change request should invoke the correct tool and confirm its result before claiming success. A fluent answer without the required tool execution should fail the test.
What should you verify when evaluating CallMissed?
As of October 2026, CallMissed’s verified fact sheet lists OpenAI-compatible endpoints, including chat completions and the Responses API, plus an Anthropic-compatible /v1/messages endpoint. Existing SDKs can connect by changing the base URL; validate each feature your application depends on against the CallMissed documentation.
The same October 2026 fact sheet lists streaming, function calling, structured outputs, caller-chosen fallback models, bring-your-own provider keys, and usage and request logs. It also specifies 1,000 free signup credits and a default Free-tier limit of 60 requests per minute per key.
Use those documented capabilities as your trial checklist. Verify log fields, access arrangements, retention, and correlation behavior directly rather than assuming unspecified guarantees.
What evidence should determine the final decision?
Keep a short decision record containing:
- Passing and failing acceptance tests.
- Configuration and SDK versions.
- Observed costs and failure behavior.
- Unresolved logging, privacy, or operational questions.
Choose the setup that makes support outcomes explainable and failures diagnosable. A managed gateway can reduce infrastructure work, but your acceptance evidence—not the deployment label—should decide whether it meets your needs.
Conclusion
Proxy-based LLM observability helps support API teams explain what happened—not merely confirm that a request succeeded. The central lesson is that HTTP 200, low average latency, and a manageable token bill cannot establish whether a customer received the correct refund policy.
The October 2026 research brief reports 203 points for the Hacker News discussion “If you don’t run your own LLM proxy, how do you know whats going on?” That is a supplied snapshot, not a verified current ranking. More important than the score is the engineering challenge behind it: jrdsgl.com advocates running a proxy “somewhere you control,” while daily.dev highlights the limitations of provider dashboards for time-series analysis.
For support developers, four takeaways should guide implementation:
- Measure the customer’s wait, not just the provider’s response. Track time to first token, complete-response time, and tail latency. Separate retrieval, tool execution, provider processing, and gateway overhead wherever your instrumentation allows, so a slow interaction leads to a specific investigation rather than guesswork.
- Make every model attempt explainable. Distinguish rate limits, provider failures, retries, fallback attempts, and interrupted streams. In the hypothetical refund workflow, a successful fallback should not erase the original timeout—or conceal the additional spending needed to produce the final answer.
- Connect spending and traces to support outcomes. Attribute token usage and cost to workflows, tenants, and resolved issues. Then connect model activity with retrieval context, tool results, policy checks, and human escalation: a proxy reveals the call sequence, but evaluation establishes whether the answer was useful and correct.
- Treat privacy as part of observability design. Decide which customer identifiers belong in logs, redact sensitive information, and define retention and access controls. Collect enough context to diagnose failures without turning support conversations into an indiscriminate archive.
What should support API teams watch next?
Watch how increasingly varied model choices and fallback paths affect the relationship between API reliability and customer success. As routing becomes more flexible, teams will need to keep checking whether faster or cheaper responses actually preserve policy accuracy and resolution quality. A fallback that restores availability can still return an answer grounded in outdated information.
As of October 2026, CallMissed’s verified fact sheet lists 124 models accessible through one API key and balance, with usage and request logs and caller-chosen fallback models. Developers can explore CallMissed as one platform within this gateway trend, while retaining responsibility for application-level evaluation and privacy decisions.
Start with one support workflow and trace its failures end to end. If tomorrow’s refund answer is wrong despite HTTP 200, will your monitoring show why—and what to fix?
Related Reading
- Kimi K3 API Pricing: Customer Support LLM Comparison
- Cheapest LLM API Provider in India in 2026: Workload-Based Cost Guide
- LLM comparison 2026: Best Models for Customer Support