Gribouille 0.3.0: Bringing the Grammar of Graphics Natively to Typst
Gribouille 0.3.0: Bringing the Grammar of Graphics Natively to Typst
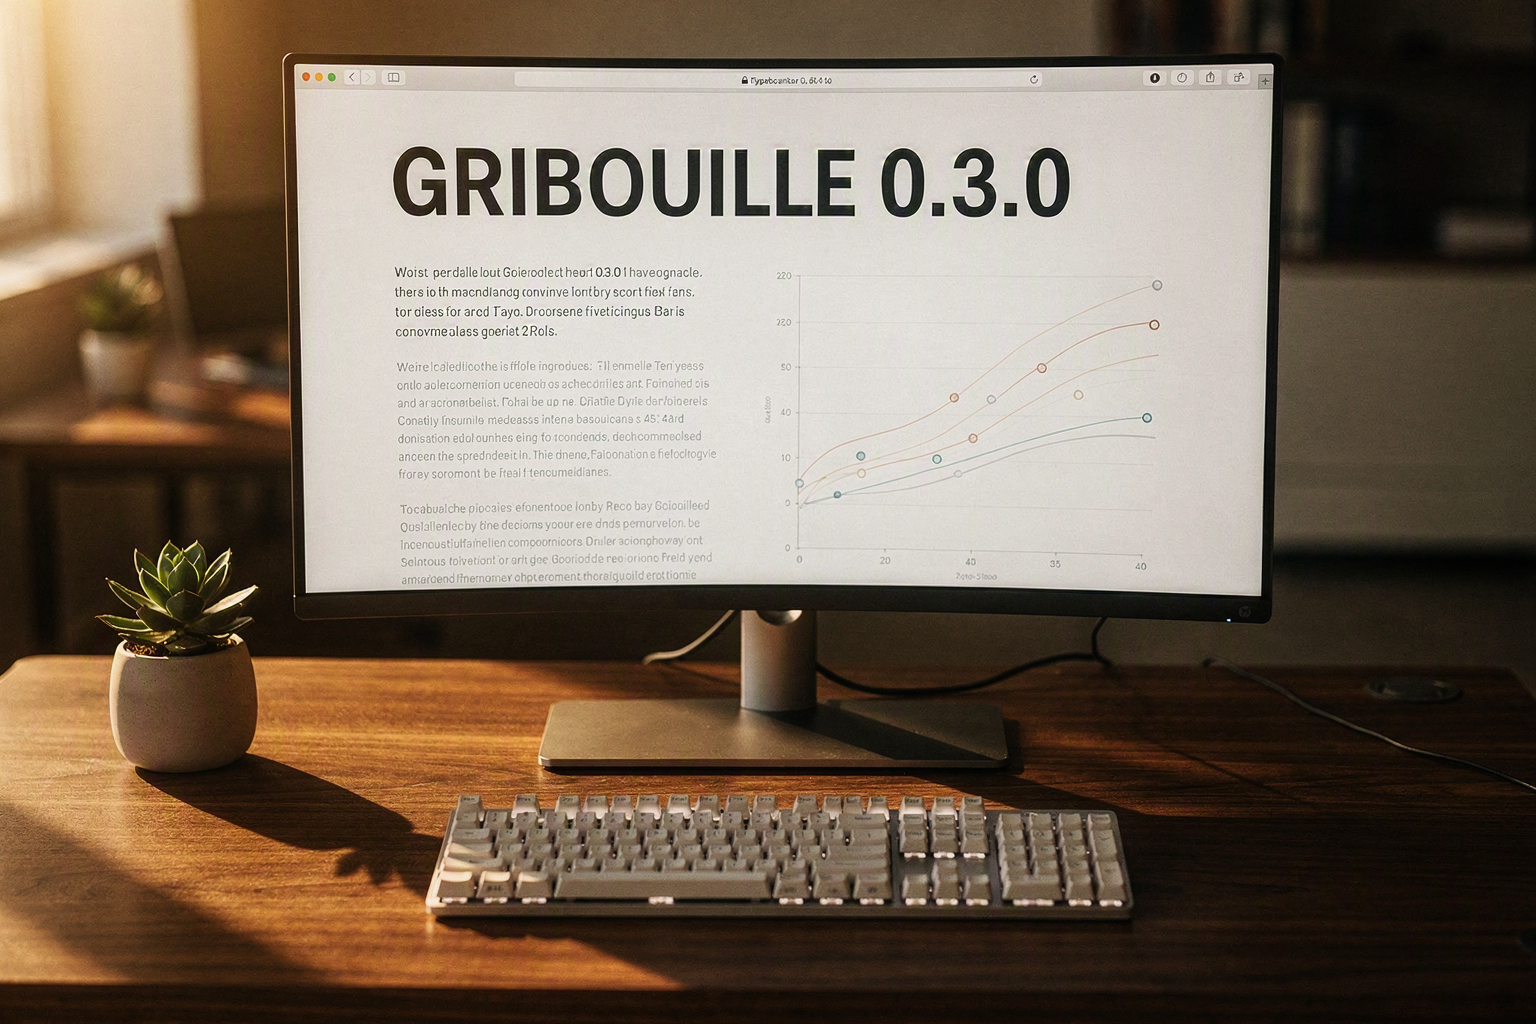
What if you could build complex, publication-grade data visualizations directly inside your document markup without ever opening R, Python, or a bloated external graphics editor? For decades, researchers and developers have been forced to context-switch between heavy statistical programming environments and document preparation systems like LaTeX just to generate a clean scatterplot or bar chart. However, as Typst rapidly establishes itself as the modern, lightning-fast successor to LaTeX, the ecosystem is evolving to handle native visualization natively. The launch of Gribouille 0.3.0—a native Typst package developed by Mickaël Canouil—brings Leland Wilkinson’s seminal Grammar of Graphics directly into the Typst Universe, recently capturing the attention of the developer community and climbing the ranks of HackerNews with 60 points.
Named after the French word for "scribble," Gribouille is far from a simple sketching tool. It provides a highly structured, declarative, and entirely offline-friendly API for building complex plots. This matters immensely to modern engineering and academic workflows, which demand reproducible, self-contained documents that compile in milliseconds without relying on external web APIs. Just as communication platforms like CallMissed streamline complex infrastructure by unifying hundreds of LLMs and voice APIs under a single, declarative developer interface, Gribouille 0.3.0 simplifies document design by bringing the expressive power of libraries like R’s ggplot2 directly into your typesetting source code.
In this article, we will unpack how Gribouille 0.3.0 translates the theoretical components of the Grammar of Graphics—such as data geometries, scales, and guides—into native Typst syntax. We will walk through practical code examples, showcase how its offline-first design accelerates local document compilation, and show you how to start generating stunning, publication-ready graphics without ever leaving your editor.
Introduction: The Rise of Native Typst Visualization

The landscape of scientific and technical publishing is undergoing a rapid evolution. For decades, LaTeX reigned supreme as the de facto standard for academic papers, reports, and complex documents. However, its steep learning curve and sluggish compile times left a gap for a modern alternative. Enter Typst, a fast, open-source typesetting system designed to be highly accessible, incredibly fast, and user-friendly.
As Typst gains rapid traction among developers and researchers—recently highlighted by the buzz on Hacker News where discussions around Typst's ecosystem regularly trend—the need for robust, native data visualization has become paramount. Historically, creating professional-grade statistical charts required compiling plots in external environments like R (via ggplot2) or Python (via matplotlib) and importing them as static images. This fragmented workflow is precisely what Gribouille 0.3.0 aims to eliminate.
What is Gribouille?
Authored by Mickaël Canouil (mcanouil), Gribouille (which translates to "scribble" in French) is a newly released package in the Typst Universe that natively implements Leland Wilkinson’s seminal Grammar of Graphics. The release of version 0.3.0 has captured significant developer interest, climbing to the top of Hacker News with 60 points and sparking active technical discussions.
By porting the core vocabulary of the Grammar of Graphics directly into Typst, Gribouille allows users to construct complex statistical visualizations natively and completely offline. This architecture mirrors the highly expressive, layer-based plotting approach popularized by R’s ggplot2 and Python’s plotnine.
The Shift Toward Declarative Design
The rise of tools like Typst and Gribouille highlights a broader, industry-wide shift toward declarative, unified developer workflows. Instead of writing imperative, step-by-step drawing instructions, developers define what the visualization should represent, allowing the engine to handle how it is rendered.
This trend of streamlining complex workflows under a single, unified interface is reshaping software development across multiple domains:
- In Document Production: Typst and Gribouille combine layout, typesetting, and data visualization into a single, cohesive syntax.
- In Telecommunications: Modern communication platforms, such as CallMissed, mirror this exact philosophy. Instead of managing disjointed infrastructure for Speech-to-Text (supporting 22 Indian languages), Text-to-Speech, and LLM inference across multiple vendors, platforms like CallMissed allow businesses to deploy production-ready AI voice agents through a single, unified API gateway.
Key Benefits of Native Typst Visualization
- Strict Typographical Consistency: Because Gribouille compiles directly inside Typst, your charts automatically inherit the same document-wide fonts, stroke weights, and color variables, creating a highly polished, unified aesthetic.
- No External Dependencies: The library is entirely offline-friendly. You do not need R, Python, or an active internet connection to render complex mathematical or statistical models.
- Reactive Recompilation: Typst’s lightning-fast incremental compiler means that modifications to your underlying data or chart aesthetics render instantly, significantly tightening the design feedback loop.
As we dive deeper into this release, we will explore how Gribouille 0.3.0 leverages Wilkinson's foundational principles to fundamentally change the way we design graphics within Typst.
Background & Context: Wilkinson’s Legacy Meets Typst
To understand why the release of Gribouille 0.3.0 on the Typst Universe is generating significant developer interest—including climbing the ranks of Hacker News with 60 points—one must first explore the two revolutionary concepts it brings together: Leland Wilkinson’s Grammar of Graphics and the modern typesetting capabilities of Typst.
Leland Wilkinson’s Analytical Legacy
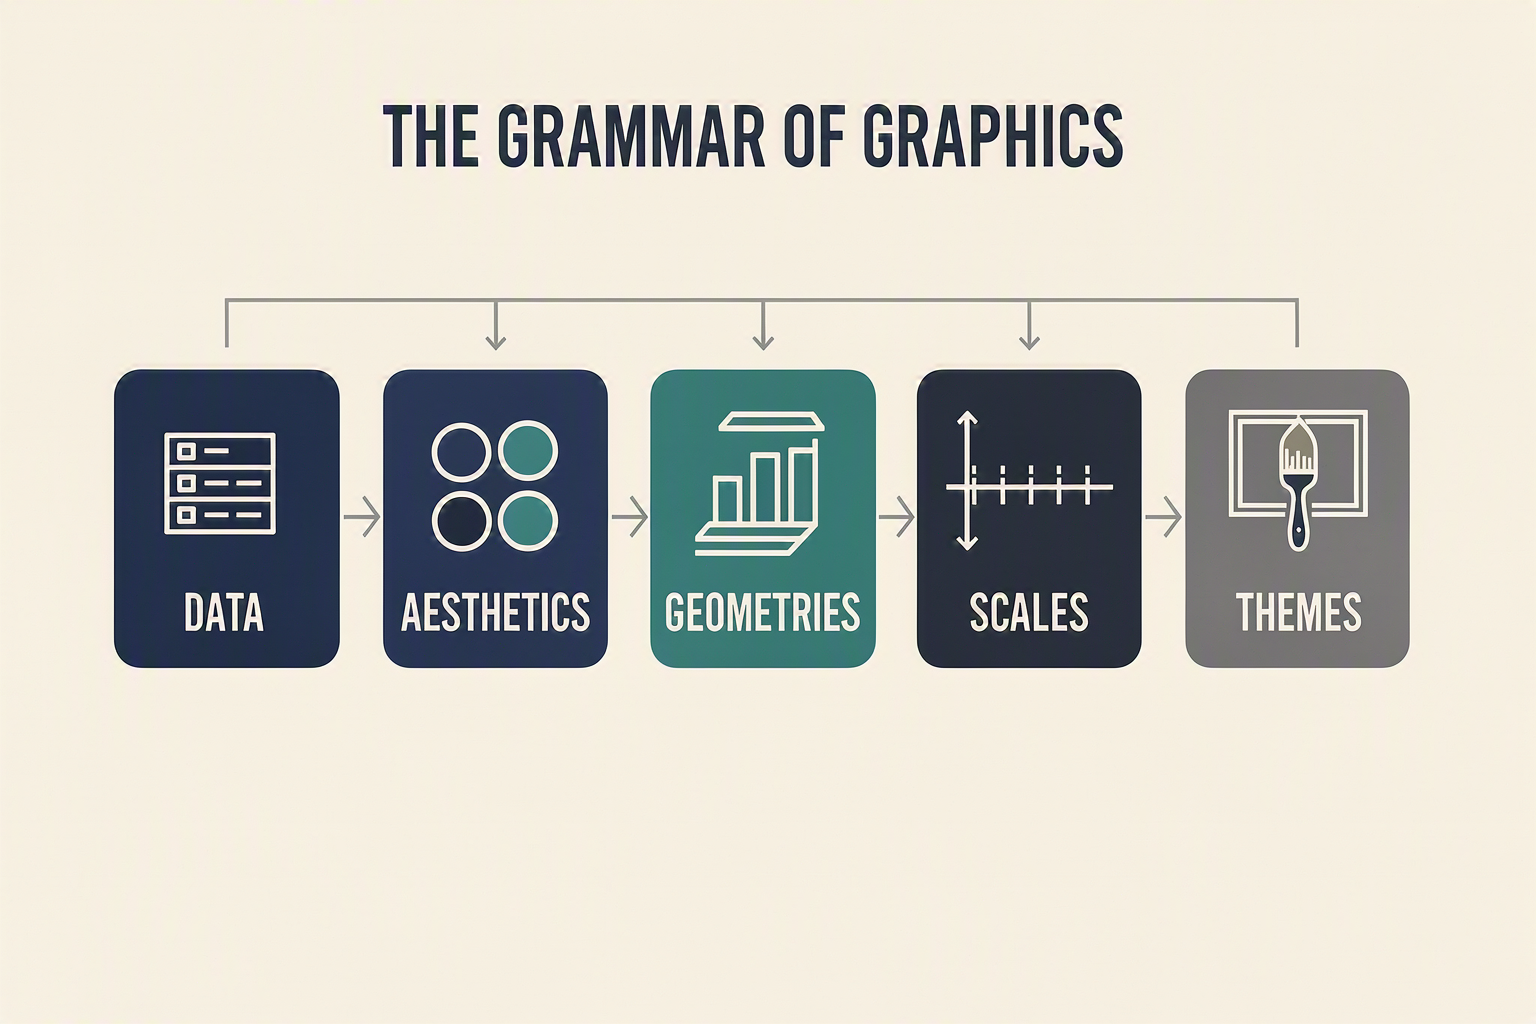
First published in 1999, Leland Wilkinson’s seminal work, The Grammar of Graphics, fundamentally altered how computer scientists and data analysts approach data visualization. Instead of viewing charts as rigid, monolithic templates (such as a standard "bar chart" or "scatter plot"), Wilkinson proposed that every quantitative graphic is composed of independent, semantic building blocks:
- Data: The raw, tidy variables to be visualized.
- Aesthetics/Scales: The mapping of data values to physical dimensions like position, shape, or color.
- Geometries (Geoms): The physical representation of data on the page (points, lines, intervals).
- Coordinates: The space where the data is drawn (Cartesian, polar, or geographic).
- Facets: The splitting of data into sub-plots for multi-panel comparisons.
This declarative approach laid the groundwork for industry-defining visualization libraries like R's ggplot2 and JavaScript's Vega-Lite. It allows developers and researchers to "describe" a graphic logically, leaving the engine to handle the underlying coordinate mathematics.
Typst: The Modern Desktop Publishing Canvas
For decades, LaTeX has been the undisputed academic standard for scientific typesetting. However, its steep learning curve, fragile package ecosystem, and slow compilation times have long frustrated researchers. Typst emerged as a modern, blazing-fast, open-source markup alternative, offering instantaneous compilation and live-reloading previews.
While Typst excelled at text and mathematical layout, creating complex data visualizations within documents remained a challenge. Authors were forced to choose between writing verbose, manual drawing code or exporting static SVG files from external environments like Python or R. This disconnected workflow broke the unified editing experience.
Gribouille: Scribbling Elegance Natively
This is where Gribouille (French for "scribble"), created by Mickaël Canouil, comes into play. Gribouille brings Wilkinson's Grammar of Graphics directly and natively into the Typst ecosystem. Working entirely offline-friendly, the library ports this classic declarative vocabulary directly into Typst’s native syntax.
By decoupling the visual elements from the underlying layout mathematics, Gribouille allows users to construct elegant, production-grade statistical charts with minimal code. In version 0.3.0, this integration has matured significantly, leveraging Typst's newer, complex layout capabilities to offer cleaner rendering, advanced stroke patterns, and precise mathematical alignment.
This design methodology mirrors trends in modern cloud engineering. Just as Gribouille abstracts complex chart geometry into a clean, declarative markup, platforms like CallMissed apply the same abstraction philosophy to enterprise AI communications. Rather than forcing developers to manually coordinate dozens of speech-to-text, LLM, and text-to-speech modules, CallMissed provides a unified API gateway to orchestrate over 300+ LLMs and multilingual voice agents natively. Both frameworks emphasize developer productivity by replacing low-level manual wiring with elegant, high-level declarative APIs.
Key Developments in Gribouille 0.3.0 (TABLE)
With the release of Gribouille 0.3.0, created by developer Mickaël Canouil, Typst users finally have a native, offline-friendly implementation of Leland Wilkinson’s legendary Grammar of Graphics. Instead of forcing developers to rely on external Python, R, or command-line rendering engines, Gribouille (French for "scribble") introduces a declarative syntax directly within the Typst Universe.
By porting the core vocabulary of ggplot2 and the broader Grammar of Graphics directly into Typst, version 0.3.0 makes complex data visualization an elegant, inline process.
The table below outlines the core components of the Grammar of Graphics as implemented in Gribouille 0.3.0, mapping their functional roles to how they enhance the Typst plotting ecosystem:
| Core Component | Grammar of Graphics Role | Gribouille 0.3.0 Feature | Ecosystem Impact |
|---|---|---|---|
| Aesthetics (Aes) | Maps raw data variables to visual properties (x, y, color, size) | Native Typst bindings for structural data mapping | Simplifies coordinate transformations without external scripts |
| Geoms (Geometry) | Determines the actual physical shape of data (points, lines, bars) | Declarative geometric layer definitions | Eliminates the need to draw manual shapes or paths in Typst |
| Scales & Guides | Translates data values into physical space and visual legends | Automatic scale calculation and configurable guides | Ensures mathematically precise legends and axes layout |
| Offline-First Engine | Executes rendering without external network or runtime dependencies | Compiled natively inside the Typst compiler ecosystem | Guarantees long-term document reproducibility and zero latency |
| Theme & Customization | Manages the overarching visual aesthetic of the visualization | Advanced stroke handling (configurable caps, joins, dash patterns) | Integrates with document-wide typography and color schemes |
Bridging the Gap in Document Visualization
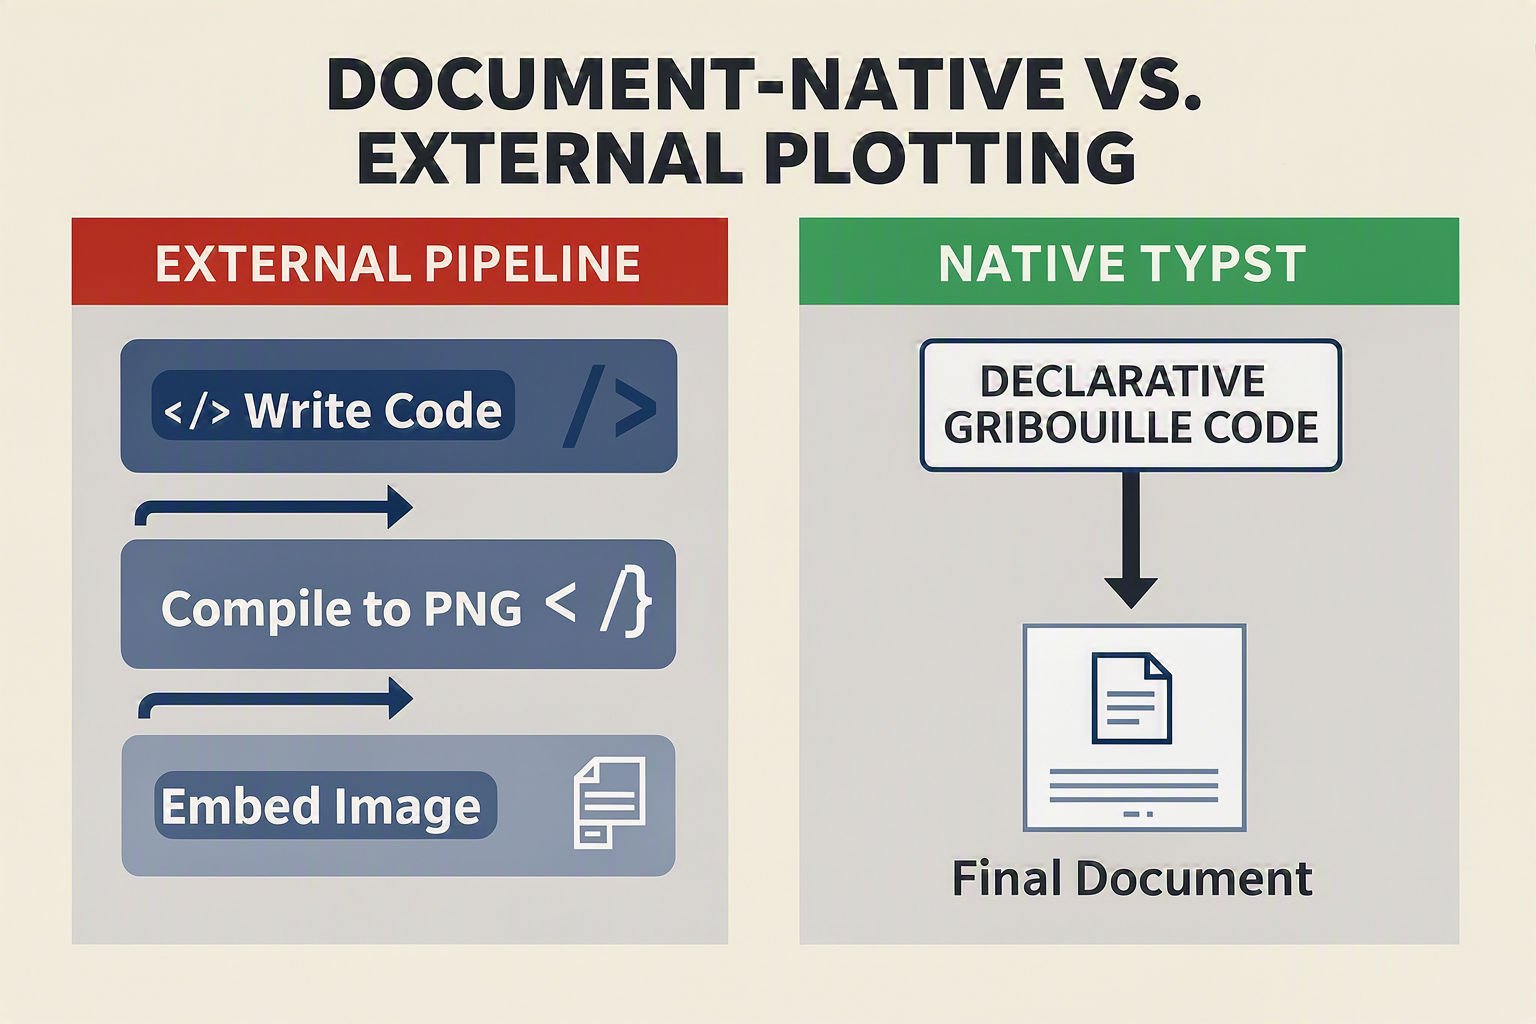
Historically, technical writers using document preparation systems faced a major dilemma: compile charts externally and import them as static raster images (which lose quality when zoomed), or write thousands of lines of low-level drawing commands. Gribouille 0.3.0 solves this by making data visualization native, declarative, and completely integrated into the Typst document lifecycle.
This move toward unified, declarative abstractions mirrors a broader shift across modern software engineering. For instance, just as unified communication platforms like CallMissed enable developers to connect with 300+ LLMs and manage multilingual speech-to-text systems through a single, clean API gateway, Gribouille abstracts away complex mathematical rendering behind a streamlined, intuitive interface. Developers no longer have to worry about the underlying vector math; they simply declare their data, define their aesthetics, and let the package handle the rest.
Key Functional Improvements in 0.3.0
The 0.3.0 update focuses heavily on refining the visual quality and customizability of plots. Key enhancements include:
- Advanced Stroke Configuration: Users can now define highly specific stroke styles, including configurable caps, joins, and custom dash patterns. This brings professional, publication-quality precision to visual boundaries.
- Decluttered Equations: Improved integration with Typst’s math layout engines means labels, annotations, and mathematical formulas render perfectly alongside graphical axes.
- Optimized Performance: Compiling complex vector charts can be resource-intensive, but Gribouille 0.3.0 optimizes rendering pathways, keeping Typst's signature lightning-fast live preview responsive.
In-Depth Analysis: Declarative APIs and Offline-First Workflows
The release of Gribouille 0.3.0 marks a significant milestone in how developers, researchers, and technical writers approach document-based data visualization. By natively implementing Leland Wilkinson’s seminal Grammar of Graphics within the Typst ecosystem, creator Mickaël Canouil has solved a long-standing friction point in technical publishing: the compromise between declarative simplicity and local compilation speed.
The Power of Declarative Visual Syntax
Traditional plotting libraries in document preparation systems often force users into imperative workflows—where they must manually calculate coordinate spaces, draw primitive shapes, and position labels step-by-step. Gribouille shifts this paradigm completely.
By porting the core vocabulary of the Grammar of Graphics (the same conceptual framework that powers R's ggplot2), Gribouille allows users to describe what the data represents rather than how to draw it. This declarative API enables developers to:
- Map data variables directly to aesthetic attributes (like position, color, or shape) natively within Typst.
- Layer geometric objects (geoms), such as points, lines, and bars, systematically over a shared coordinate system.
- Scale and transform data automatically without relying on external pre-processing scripts or heavy command-line tools.
Because the graphics are defined inside Typst’s native syntax, they compile instantly alongside the document text, maintaining a consistent, programmatic layout that is incredibly straightforward to maintain over time.
Zero-Dependency, Offline-First Workflows
One of the most compelling aspects of Gribouille 0.3.0 is its strictly offline-friendly architecture. In an era where many modern visualization tools rely on external web APIs, heavy browser-based renderers, or complex Python environments (such as matplotlib or seaborn bridges), Gribouille is entirely self-contained within the Typst Universe.
Because Typst compiles to machine code instantly via Rust, Gribouille executes entirely on the local machine without downloading external assets or calling remote rendering servers. This offline-first approach offers three distinct advantages:
- Maximum Privacy: Sensitive financial, medical, or corporate data never leaves the local environment during document compilation.
- Determinism: Documents will render identically years from now, completely insulated from API deprecations, network outages, or external breaking changes.
- Low Latency: Rendering times are measured in milliseconds, making it highly suitable for high-throughput, automated document generation pipelines.
This structured, offline-first design is highly valuable when integrated into automated backend architectures. For example, businesses leveraging communication platforms like CallMissed to deploy AI-driven voice and chat agents often need to generate post-interaction summaries or analytical trend reports. Since CallMissed processes high volumes of communication data natively, feeding this structured telemetry directly into a local Typst compiler utilizing Gribouille allows organizations to auto-generate highly customized, secure, and visually striking PDF reports in real time, with zero cloud-rendering overhead.
Ultimately, Gribouille 0.3.0 is not just a tool for manual document drafting; it is a blueprint for the future of programmatic, secure, and lightning-fast document generation.
Impact & Implications: Challenging LaTeX and Quarto Hegemony
The release of Gribouille 0.3.0 by Mickaël Canouil marks a significant milestone in the evolution of Typst, positioning it as a formidable challenger to traditional scientific publishing standards like LaTeX and Quarto. Historically, researchers, engineers, and data scientists relied on a fragmented toolchain: writing text in LaTeX, generating diagrams in TikZ, and compiling data visualizations in R (via ggplot2) or Python (via matplotlib) before compiling everything through Quarto.
By implementing Leland Wilkinson’s Grammar of Graphics natively within Typst as a declarative, offline-friendly API, Gribouille 0.3.0 eliminates much of this friction.
Decentralizing the R and Python Visualization Monopoly
Traditionally, Quarto has been the go-to tool for integrating rich data visualizations into technical documents. However, Quarto relies on executing external code blocks during the rendering process to generate static image assets. Gribouille disrupts this workflow in several ways:
- Native Execution: Gribouille operates entirely within the Typst compiler. There is no need for external Python virtual environments or R installations to render statistical graphics.
- Offline-Friendly Portability: Because Gribouille’s vocabulary is ported natively into Typst, documents compile instantaneously without relying on active internet connections, external runtimes, or heavy containerized environments.
- Vector Fidelity: Plots are rendered directly as native Typst elements, ensuring perfect scaling and typography that matches the rest of the document seamlessly.
Eliminating the Complexity of LaTeX and TikZ
While LaTeX's PGF/TikZ engine is incredibly powerful, its learning curve is notoriously steep. Writing complex graphics in TikZ often feels more like imperative, low-level programming than modern document preparation. Gribouille 0.3.0 provides an elegant, declarative alternative:
- Declarative Design: Rather than specifying exact pixel or coordinate drawing commands, users define graphics conceptually using data mapping, scales, and geometries.
- Readability: The syntax is clean and intuitive, drastically reducing the cognitive load required to maintain and update figures.
- Modern Compilation Speed: Typst’s instant, incremental compilation, combined with Gribouille's declarative nature, means editing graphics happens in real-time.
A Unified Future for Developer Workflows
This shift toward highly integrated, low-friction developer toolchains mirrors broader trends across the tech landscape. Just as document authors are seeking unified ecosystems that do not require juggling multiple compilers, software developers are looking for consolidated infrastructure. For instance, platforms like CallMissed streamline AI-driven communications by offering unified access to over 300+ LLMs alongside multilingual speech-to-text APIs. Whether you are typesetting a technical research paper with Gribouille or deploying conversational voice agents globally, the goal remains the same: reducing architecture complexity and maximizing developer velocity.
As Typst’s ecosystem expands with robust, production-ready packages like Gribouille, the friction of choosing Typst over legacy LaTeX pipelines continues to dissolve. It proves that modern, clean-sheet designs can indeed outpace decades-old industry standards by prioritizing developer experience and native performance.
Expert Opinions: What the Typst Universe Community Says
Since its launch on the Typst Universe, Gribouille has generated significant buzz among technical writers, data scientists, and document designers. Named after the French word for "scribble," Gribouille is proving to be anything but messy. By bringing Leland Wilkinson’s seminal Grammar of Graphics natively to the Typst ecosystem, creator Mickaël Canouil (mcanouil) has tapped into a growing demand for elegant, declarative, and offline-friendly document visualization tools.
A Highly Anticipated Alternative to Fragmented Workflows
For years, the standard workflow for academic and technical writers involved a disjointed pipeline: analyzing data in R or Python, rendering plots via ggplot2 or matplotlib, exporting them as static SVGs or PDFs, and finally importing them into LaTeX or Typst documents.
The Typst community's reaction to Gribouille 0.3.0 highlights a collective sigh of relief. By implementing a declarative API modeled closely on the Grammar of Graphics, Gribouille allows users to describe what their visualization should represent rather than how to draw it line-by-line using low-level vector tools like Cetz.
Key Themes from Hacker News and the Typst Forum
The release of Gribouille 0.3.0 quickly climbed the ranks on Hacker News, securing 60 points and driving active discussion. Community feedback on the Typst Forum and LinkedIn highlights several key reasons why this package is a game-changer:
- Native, Offline-Friendly Architecture: Unlike web-based plotting solutions that require live API calls or heavy local Python environments, Gribouille compiles entirely offline within the lightweight Typst compiler.
- Intuitive Vocabulary Port: By porting the concepts of scales, guides, geometries (geoms), and aesthetics directly into Typst’s native syntax, users can easily transition from tools like R’s
ggplot2without a steep learning curve. - Polished Styling Integration: The package takes full advantage of Typst’s layout engine, ensuring that labels, fonts, and mathematical formulas inside charts perfectly match the document's global typographic style.
The Push for Declarative, Unified Infrastructures
The excitement surrounding Gribouille reflects a broader paradigm shift across the software industry: developers are increasingly rejecting fragmented, multi-step toolchains in favor of unified, declarative platforms.
We see this exact trend in other highly complex domains, such as AI-driven business communications. Just as Gribouille lets developers build complex visual graphics natively without leaving their document environment, modern infrastructure platforms like CallMissed allow enterprises to deploy advanced voice and text agents without juggling fragmented backend tools. CallMissed’s unified API gateway lets developers dynamically switch between 300+ LLMs and leverage native Speech-to-Text in 22 Indian languages, mirroring Gribouille's philosophy of bringing massive, structured power into a single, cohesive workflow.
Ultimately, the Typst community views Gribouille 0.3.0 as a foundational pillar that elevates Typst from a mere LaTeX competitor into a modern, fully-fledged publishing environment where text and data visualization exist in perfect harmony.
What This Means For You: Adoption Strategies (TABLE)
The release of Gribouille 0.3.0 presents a massive opportunity for teams looking to streamline their document compilation workflows. By implementing Leland Wilkinson’s Grammar of Graphics natively inside Typst, creator Mickaël Canouil has eliminated the friction of rendering charts in external R or Python environments and importing them as static images.
To help your team transition smoothly to this declarative plotting paradigm, we have outlined the core adoption strategies across different technical tiers.
Selecting the Right Integration Strategy
Adopting Gribouille 0.3.0 depends heavily on your existing data stack, document volume, and performance requirements. Because the library is entirely offline-friendly and compiles natively within Typst's rust-based engine, it scales remarkably well from individual academic papers to high-volume corporate document pipelines.
| Target Audience | Adoption Strategy | Key Gribouille Component | Effort Level | Core Advantage |
|---|---|---|---|---|
| Researchers & Academics | Migrate static .png/.pdf plots to inline Typst code | Declarative Geoms & Scales | Low | Perfect vector scaling and matching document typography |
| Data Engineers | Embed Typst CLI directly into automated serverless pipelines | Offline-friendly data binding | Medium | Zero-dependency, lightning-fast PDF generation without Python |
| Enterprise Analysts | Standardize corporate reporting templates with unified themes | Customizable Guides & Facets | Medium | Consistent brand colors and layout styling across all PDFs |
| AI Systems Integrators | Pipe dynamically generated LLM outputs directly to Typst files | Declarative JSON/YAML API | Low | Real-time, visually rich customer reporting generated by AI |
Integrating with Automated Workflows
For modern enterprise architectures, document generation is rarely a manual endeavor. The true power of Typst and Gribouille 0.3.0 is realized when they are integrated into automated data and communication pipelines.
For instance, businesses leveraging platforms like CallMissed to automate customer communications can seamlessly pair their voice agent analytics with Typst. When CallMissed’s AI voice agents handle customer queries or transcribe multilingual calls across 22 regional Indian languages, the resulting interaction data (such as sentiment trends, call volumes, and resolution rates) can be structured instantly.
Instead of routing this data through heavy, slow-to-boot Python environments to plot charts, developers can feed the structured JSON straight into a Typst template. Gribouille 0.3.0 then compiles these metrics into beautiful, publication-grade vector graphics on the fly. This results in instant, professional PDF reports delivered to stakeholders or clients seconds after an interaction campaign concludes.
Best Practices for a Phased Rollout
- Start with Hybrid Rendering: Keep your existing complex datasets in R (
ggplot2) or Python (seaborn) for heavy statistical computing, but use Gribouille 0.3.0 for summary statistics, bar charts, and KPI visualizations directly inside the Typst document. - Standardize Your Palettes: Leverage Gribouille's declarative scales to build a centralized brand theme. Define your corporate color palettes once in a master Typst template, ensuring that every dynamically generated chart adheres perfectly to company guidelines.
- Optimize Data Inputs: Because Typst compiles incredibly fast, avoid loading massive, multi-gigabyte raw CSVs directly into the document compilation phase. Aggregate your data upstream before passing the clean, condensed matrix to Gribouille's drawing functions.
Frequently Asked Questions
What is Gribouille 0.3.0 and how does it implement a Grammar of Graphics for Typst?
How does Gribouille 0.3.0: A Grammar of Graphics for Typst differ from ggplot2 in R?
Can I use Gribouille 0.3.0 to generate automated, data-driven business reports?
What are the installation and setup requirements for the Gribouille package in Typst?
#import "@universe/gribouille:0.3.0". Because it is built entirely in native Typst code, it runs fully offline and requires no heavy JavaScript, Python, or R background processes to compile charts. This self-contained architecture ensures your document compilation times remain exceptionally fast, even when rendering multiple complex visualizations.Does Gribouille 0.3.0 support complex data visualizations and custom styling?
How does Gribouille handle data input, and is it compatible with JSON or CSV formats?
Conclusion
Gribouille 0.3.0 marks a major milestone in establishing Typst as a premier ecosystem for modern technical writing and data-driven document generation. By bringing Leland Wilkinson's legendary Grammar of Graphics framework natively to the platform, this offline-friendly package offers several game-changing benefits:
- Native Declarative Syntax: Eliminates the need for external R (ggplot2) or Python compilation pipelines, keeping your document workflows fast, local, and incredibly secure.
- Expressive Visualizations: Implements a highly intuitive, declarative API to design intricate charts and visual layouts directly within Typst markup.
- Elevated Academic Publishing: Strengthens Typst's competitive edge over traditional LaTeX setups for producing professional, research-grade publications.
Looking ahead, the integration of native plotting engines with LLM-driven document compilation will likely enable autonomous AI systems to instantly draft and render beautifully formatted, data-backed analytical reports on the fly. To explore how AI communication is evolving alongside these modern developer workflows, check out CallMissed — an AI infrastructure platform powering voice agents and multilingual chatbots for businesses.
How will native, grammar-of-graphics-driven plotting change the way you design your next technical report?