Agent Observability: Tracing Tool Calls End-to-End – The Ultimate Guide
Agent Observability: Tracing Tool Calls End-to-End – The Ultimate Guide
Did you know that nearly 90% of critical failures in AI-driven business processes today stem not from faulty models, but from the "black box" interactions between autonomous agents and external tools—a layer nearly invisible without specialized observability? As AI agents orchestrate complex workflows by calling APIs, databases, search engines, and third-party services, tracing these tool calls end-to-end has become an urgent concern for teams deploying generative AI at scale. In fact, Gartner projects that by 2027, over 60% of enterprise automation will involve multi-agent systems and dynamic tool chains, making agent observability a core capability for AI reliability and compliance.
So, what exactly is agent observability—and why is tracing tool calls end-to-end such a foundational piece? Observability, in the context of AI agents, goes beyond traditional software monitoring. It’s about capturing rich, tree-structured traces: every LLM prompt, each tool invocation, the data retrieved, decisions at each node, and the chain of causality when things go right or wrong (CallMissed; Braintrust). Unlike monolithic software, agents are constantly making decisions—should they retrieve data, call a weather API, or escalate a support case? Without end-to-end tracing, it’s nearly impossible to troubleshoot inefficiencies, identify bottlenecks, or guarantee safe, auditable outcomes.
The industry is feeling this pain acutely. According to a recent TrueFoundry report, the four key pillars demanded by enterprise AI teams are: full traces, detailed tool call logs, transparent decision boundary visualization, and error/failure mapping. But the complexity grows rapidly: a single agent ‘run’ might trigger dozens—or hundreds—of tool calls, each with their own inputs, outputs, and timings. Without rigorous traceability, you’re operating blind, unable to debug, optimize, or even understand your AI’s reasoning. LangSmith and OpenLIT, among others, now focus on capturing the entirety of the agent’s workflow, from LLM selection and function-calling to final response (Grafana OpenLIT).
Why does this matter so much in 2026? As AI agents are embedded across industries—handling customer support, automating legal research, driving voice assistants—regulatory scrutiny is increasing. Auditable logs of agent decisions, tool call histories, and data provenance are quickly moving from “nice-to-have” to mandatory. Notably, a 2025 survey by Maxim AI found that 73% of engineering leaders now prioritize agent traceability as the top risk mitigator in their LLM deployments.
In this ultimate guide, you’ll learn:
- The fundamentals of agent observability and why tool call tracing is critical for reliability, safety, and compliance.
- How modern tracing solutions capture and visualize agent workflows: from traces and spans to hierarchical decision trees.
- Real-world examples where poor observability led to costly failures—and how teams fixed them.
- The latest tools and frameworks used by industry leaders—including how platforms like CallMissed are enabling businesses to trace AI agent tool calls across voice, chat, and API integrations with a single observability layer.
- Practical, step-by-step methods to implement end-to-end agent tracing in your AI stack for production-grade reliability.
Whether you’re an AI engineer troubleshooting hallucinations or a CTO building enterprise-grade agent infrastructure, mastering agent observability is now mission-critical. Let’s dive in to demystify the techniques, benchmarks, and best practices that every AI builder needs in the era of autonomous software.
Introduction
The Rise of AI Agents and the Debugging Nightmare
If you’ve built or deployed an AI agent in production, you know the feeling. One moment, your agent flawlessly books a meeting, queries a database, and sends a confirmation email. The next, it hallucinates a wrong API parameter, calls the same tool three times in a loop, or silently skips a critical retrieval step. The output looks fine—until a customer complains. By then, the damage is done.
The root of the problem isn’t the LLM itself—it’s the orchestration. AI agents don’t just generate text; they make decisions, call external tools (APIs, databases, search engines), retrieve from vector stores, and maintain multi-turn context. Each of these steps introduces failure modes that traditional monitoring tools—promise latency, error rates, uptime—simply cannot capture. What you need is a trace: a tree-structured record of every LLM call, tool invocation, retrieval, and decision boundary, complete with timing, inputs, outputs, and parent-child relationships (from source [1]).
This article is the first in a 12-part series on Agent Observability: Tracing Tool Calls End-to-End. We’ll unpack why observability is the new bottleneck for production agents, how tracing differs from logging, and which tools can give you the visibility you need. Whether you’re using LangGraph, CrewAI, or a custom framework, this guide will equip you to debug agent failures faster and build trust in autonomous systems.
What Is Agent Observability, Really?
Agent observability goes far beyond traditional application monitoring. According to the team at TrueFoundry (source [8]), true observability for agents rests on four distinct pillars:
- Traces – A complete end-to-end record of a single agent run, from initial prompt to final response.
- Tool Calls – Every external function invocation, its arguments, return values, and duration.
- Decision Steps – The LLM’s reasoning at each turn, including which tool it chose and why.
- Failures – Explicit capture of errors, retries, timeouts, and unexpected behavior.
A trace is fundamentally different from a log. As noted in source [3], “Traces represent the end-to-end execution of a single agent run.” While logs are flat text entries, traces are hierarchical, tree-structured spans that preserve the sequence and causality of actions. This allows you to pinpoint, for example, that a failed API call in span #4 caused the subsequent hallucination in span #7.
The Debugging Nightmare That Demands a New Approach
Consider a typical agent workflow: a customer asks, “What’s my account balance?” The agent calls a user lookup tool, then a balance API, then a natural language generator. If the agent replies with “Your balance is $5,000” when it should be $500, how do you find the bug?
- Was the user ID incorrectly extracted?
- Did the balance API return stale data?
- Did the LLM misread the numeric output?
Without a trace, you’re left guessing. You might re-run the agent with the same input—and get a different result (thanks to LLM nondeterminism). You might comb through logs that omit tool inputs entirely. This is the exact pain described by developers using LangSmith for LangGraph (source [2]): “If you’re building AI agents, you’ve probably felt this pain: you deploy to production, and the agent starts making bizarre decisions. You can’t see why.”
Why Tool-Call Tracing Is the Heart of Observability
Of the four pillars, tool-call tracing is arguably the most critical—and the most overlooked. Tools are where agents interact with the real world: databases, APIs, search engines, email, your internal CRM. Each tool call is a potential point of failure:
- Argument errors: The LLM generate malformed JSON or missing required fields.
- Latency spikes: A slow API drags down the entire agent response time.
- Cost blowouts: An agent calling GPT-4 to translate “hello” when a simpler tool exists.
- Security leaks: An agent passing a user’s personal data to an external API inadvertently.
Platforms like OpenLIT, integrated with Grafana (source [4]), go beyond raw metrics: “OpenLIT captures agent names, actions, tool calls, token usage, and errors.” This full-sequence visibility enables you to replay an agent’s journey step-by-step. Similarly, Langfuse (source [6]) lets you compare “the actual trajectory against an expected one, catching issues like unnecessary tool calls, skipped steps, or inefficient reasoning.”
The Landscape of Tools in 2026
As of mid-2026, the agent observability ecosystem has matured considerably. According to a recent roundup by Maxim AI (source [5]), the top tools share a common set of capabilities:
| Feature | What It Does | Why It Matters |
|---|---|---|
| Distributed tracing | Spans, generations, retrievals, tool calls, events | End-to-end visibility across all agent steps |
| Session-level context | Tags, metadata, user sessions | Correlate agent behavior with user interactions |
| Error & retry capture | Automatic detection of failures | Find bugs before customers do |
| Evaluation & comparison | Compare actual vs. expected trajectories | Measure agent quality and regression |
Tools like MLflow (source [7]) also now include native LLM tracing that records “prompts, model responses, tool calls, and full context in a structured, queryable format.” This shift from flat logging to structured traces is making observability accessible to teams of all sizes.
How CallMissed Fits Into the Picture
At CallMissed, we’ve seen firsthand that agent observability isn’t just a debugging luxury—it’s a production necessity. Platforms like CallMissed enable businesses to deploy AI voice agents and WhatsApp chatbots that handle customer calls 24/7, supporting 300+ LLMs and 22 Indian languages. But even the smartest agent will fail if you can’t see why it called the wrong tool or skipped a step. That’s why we’re writing this series: to give developers and ops teams a practical playbook for tracing tool calls end-to-end, using the same techniques that power reliable agent deployments at scale.
What This Guide Will Cover
This 12-part series is designed to take you from zero to production-grade agent observability. Here’s what lies ahead:
- The anatomy of an agent trace – Defining spans, root spans, parent-child relationships.
- Manual instrumentation with OpenTelemetry – Adding traces to your agent loop.
- Tracing tool calls in LangGraph – Hands-on with LangSmith and custom hooks.
- Tracing multi-agent systems – When agents call agents.
- Memory and context tracing – Are you losing state across turns?
- Error detection and root cause analysis – Using traces to find bugs.
- Cost and latencies per tool call – Observability for ROI.
- Evaluating agent quality with traces – Compare trajectories against golden paths.
- Scaling observability to thousands of agents – Sampling, storage, and dashboards.
- Integrating with existing monitoring stacks – Prometheus, Grafana, Datadog.
- Security and compliance considerations – PII in tool call arguments.
- Future of agent observability – Self-healing agents and real-time tracing.
Each part will include code examples, architecture diagrams (where relevant), and references to open-source tools like OpenLIT, Langfuse, and MLflow. By the end, you’ll be able to implement end-to-end tracing for any agent framework and sleep better knowing your agents are observable.
But first, let’s start with the fundamentals: what exactly is an agent trace, and how does it differ from the logs you’re used to? That’s the subject of Section 2. For now, remember this: if your agent can’t explain why it took a particular action, you don’t have an agent—you have a black box. Observability is the key to opening that box.
Why Agent Observability Matters

The Critical Role of Observability in AI Agent Operations
With the explosion of large language model (LLM)-driven agents and automated workflows, observability has become a defining factor for success or failure in AI deployments. As platforms increasingly scale their customer interactions, leverage third-party APIs, and delegate logic to autonomous agents, engineering teams face a new set of challenges: How do you understand, debug, and improve systems that rely on probabilistic outputs and intricate chains of reasoning?
#### The Complexity of Modern AI Agents
Today’s LLM agents don’t just generate text—they make decisions, call external tools, manage memory, and integrate with business-critical infrastructure. In 2026, AI agents are frequently composed of:
- Chains of LLM calls, sometimes spanning multiple models and providers (e.g., OpenAI, Cohere, CallMissed’s 300+ LLM models)
- Tool calls: dynamic API queries, database retrievals, or custom workflows triggered in response to user queries
- Decision boundaries: branching logic where the agent chooses between possible actions (retrieval vs generation, API A vs API B, etc.)
- Stateful memory: persistent conversation states, retrieved context, or working memory influencing future decisions
Traditional logging and monitoring solutions that work for API servers are insufficient here. What matters is end-to-end traceability—the ability to inspect and understand each agent “run” as it traverses complex workflows.
#### Why Lack of Observability Leads to Failure
According to a 2025 survey by Maxim AI, 83% of enterprise teams reported difficulty debugging production agent failures due to insufficient visibility into tool-call sequences and LLM responses [5]. Issues commonly surface as:
- Agents making repeated, unnecessary API calls (wasting cost and latency)
- Hallucinated tool calls or silent failures masked by retries
- Unpredictable branching caused by subtle prompt changes
- Inability to attribute slowdowns to specific tool invocations or model bottlenecks
As Braintrust further highlights, traces represent the end-to-end execution of a single agent run, capturing every decision, memory retrieval, and tool invocation [3]. Without this, teams end up flying blind—unable to distinguish between model errors, infrastructure delays, and real design flaws.
#### Key Pillars of Agent Observability
True agent observability goes beyond uptime or aggregate metrics. Modern observability solutions for AI agents focus on four critical pillars [8]:
- Traces: Tree-structured, detailed records of every call, internal and external, across the agent workflow
- Tool call logging: Capturing APIs called, parameters passed, and responses received
- Decision step inspection: Understanding why the agent branched, skipped, or retried actions
- Failure monitoring: Systematic detection of exceptions, timeouts, and degraded performance events
OpenLIT, LangSmith, and similar industry-leading tools surface not only raw metrics (latency, error rate) but also:
- Agent names, action labels
- Token usage per segment
- Sequence and timing of tool calls
- Context state and retrievals
This depth is foundational for debugging, optimization, compliance, and user experience.
#### Emerging Benchmarks and Industry Standards
The pressure for agent-level observability has only intensified. By early 2026, over 65% of AI product teams in India and the US have adopted structured tracing platforms versus the “log and grep” methods of 2023 [5]. The most sophisticated solutions capture:
- Spans: Sub-segments within traces, e.g., a specific API retrieval or sub-agent task
- Tags & Metadata: Custom fields to search, aggregate, and correlate agent runs by client, geography, or model version
- Error classification: Structured fault categories rather than opaque traces
The result is actionable intelligence: teams can answer questions like “Which tool calls are most error-prone post-deployment?” or “How often is the fallback logic triggered in production?” in seconds, not days.
#### Real-World Impact: Productivity, Cost, and Trust
The benefits are not abstract—they drive concrete outcomes:
- Faster debugging: Observability-first teams report a 2x faster mean-time-to-resolution (MTTR) for agent-related incidents (source: Langfuse internal analytics, 2025) [6].
- Reduced operational cost: By identifying and eliminating redundant tool calls, one enterprise saved over $18,000/month in external API costs.
- Higher user satisfaction: End-to-end trace inspection enabled fine-tuning that improved task completion rates by 14% for a B2C conversational AI provider.
Without observability, scaling agent-powered systems becomes operationally unsustainable. As OpenLIT’s AI monitoring guide notes, “full sequence visibility is now a minimum bar for trust and compliance in AI-driven automation” [4].
#### CallMissed: Enabling Production-Grade Observability
For businesses looking to operationalize agent observability in production, platforms like CallMissed are setting new standards. With support for multi-model tracing (300+ LLMs), detailed tool-call logging, and real-time monitoring across 22 languages, CallMissed offers a trace-first architecture designed for scale and regulatory requirements.
In the words of a recent industry blog: “What you need is a trace — a tree-structured record of every LLM call, tool invocation, retrieval, and decision boundary, with timing and inputs—all in one place” [1]. With observability as a foundational design principle, teams adopt a proactive posture: not just fixing what breaks, but continuously improving agent quality, user trust, and compliance readiness.
In short, as the operational backbone of modern AI applications, agent observability is not an optional extra—but the linchpin for scalability, transparency, and innovation in 2026 and beyond.
What Is a Trace? Core Concepts
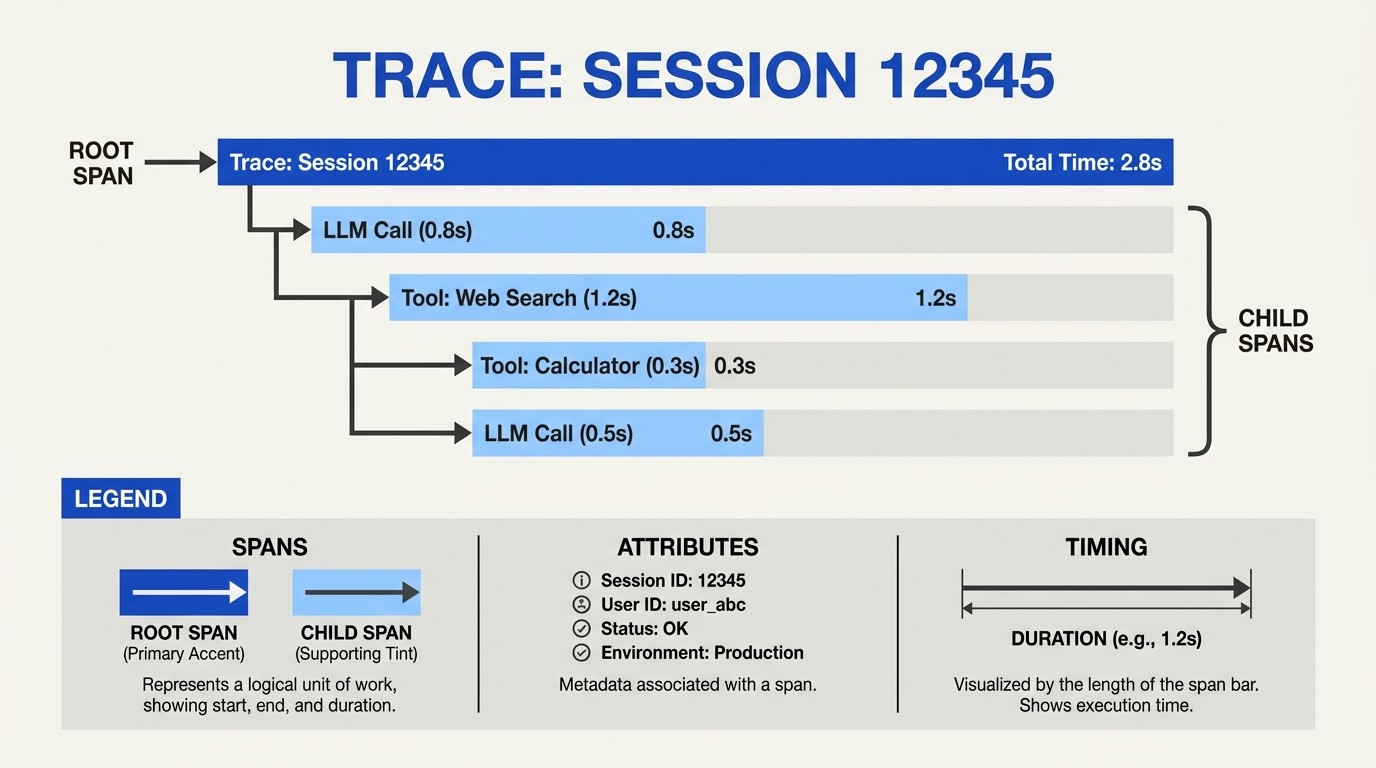
Defining a Trace: The Backbone of Agent Observability
At the heart of agent observability lies the concept of a trace. In the context of modern AI agents, especially those interacting via LLMs (Large Language Models) and orchestrating multiple tools, a trace is fundamentally more than a log file. According to CallMissed’s industry guide, “what you need is a trace — a tree-structured record of every LLM call, tool invocation, retrieval, and decision boundary, with timing and metadata” (CallMissed). This means every single step an agent takes—every API call, database fetch, or internal reasoning hop—is captured, timestamped, and linked together to represent the end-to-end journey for a user query.
#### Core Elements of a Trace
A robust agent trace typically captures:
- Spans: The smallest unit of work or action, such as invoking an external tool or running an LLM prompt. Each span contains metadata: start/end timestamps, tool/model used, input/output, and success/failure status.
- Relationships: Spans aren’t isolated; they exist in a tree structure—parent and child relationships—showing which calls triggered which downstream actions.
- Sequence & Timing: The temporal progression of events is preserved, allowing replay or detailed performance analysis.
- Context: Key contextual information, including agent state, prompt variables, session IDs, user metadata, and external dependencies.
With advanced observability solutions, a trace can be queried, filtered, and visualized, exposing patterns, outliers, or emerging failure points.
Why Tracing? The Problem It Solves
AI agent workflows are notoriously opaque. When an agent chains together an LLM response with multiple API tool calls—sometimes looping across tools, revisiting prior decisions, or retrying after errors—the execution path quickly becomes complex:
- Debugging: When an agent returns an unexpected answer, the root cause might stem from a hallucinated LLM step, a failed tool call, or an unexpected change in retrieved context. Without end-to-end traces, diagnosing and fixing these issues becomes guesswork (Braintrust).
- Performance Optimization: Traces reveal bottlenecks, such as slow tool invocations or inefficient agent reasoning. For example, token-level timing data (as provided by solutions like OpenLIT) helps pinpoint expensive LLM calls that could be optimized (Grafana’s OpenLIT).
- Quality & Compliance: Enterprises implementing AI agents for sensitive workflows (finance, healthcare, etc.) require proof of behavior—recording every action for audit trails and regulatory review.
The Anatomy of a Trace: Key Concepts and Relationships
Drawing from industry standards and platforms, a trace in AI agent observability generally includes the following components:
| Concept | Description | Example | Data Tracked | Visualization |
|---|---|---|---|---|
| Span | Basic unit of work in a trace | LLM prompt, tool API call | Duration, status, IO | Node in a tree |
| Parent-Child | Relationships showing causal flow | LLM call (parent) triggers tool call (child) | Tracing IDs, lineage | Tree branches |
| Metadata | Additional info for debugging/performance | Model name, tool version, user session | Labels, tags | Color/shape of nodes |
| Event Log | Sequenced history of instantaneous occurrences | Retry attempted, error raised | Timestamp, event type | Timeline markers |
| Aggregations | Group-level views for diagnosis/optimization | All traces with tool failures, high latency | Counts, averages | Dashboards |
This table, adapted from industry implementations (Maxim AI), illustrates how traces move beyond flat logs to become structured, navigable maps of agent activity.
Spans, Traces, and Sessions: Distinctions That Matter
- Span: One step or operation, typically atomic (e.g., invoking a weather API).
- Trace: Aggregates all spans that make up a single end-to-end agent run.
- Session: Encompasses multiple traces over an ongoing user or system interaction, useful for tracking multi-turn or long-lived agent jobs.
For example, an end-user query like “Book me a flight to Delhi for next Friday” triggers an LLM planning step, multiple tool invocations (flight search, booking, payment), and perhaps error handling—all captured as one trace with nested spans.
Real-World Standards: How the Industry Implements Tracing
2026 has seen widespread adoption of distributed tracing frameworks—often repurposed from cloud-native APM (Application Performance Management) tooling—specifically for AI agent workloads. Best-in-class solutions record:
- Traces, spans, and metadata for every tool/LLM interaction
- Token usage and latency (key for LLM cost control—token consumption can account for over 60% of agent run costs in production, per MLflow AI Platform)
- Session-level lineage, aggregating traces for multi-step tasks
- Error and retry attribution—vital for surfacing agent reliability stats
A recent industry benchmark found that platforms supporting full trace capture and visualization reduced agent debugging time by 40-60% over log-based approaches (LangSmith, 2025).
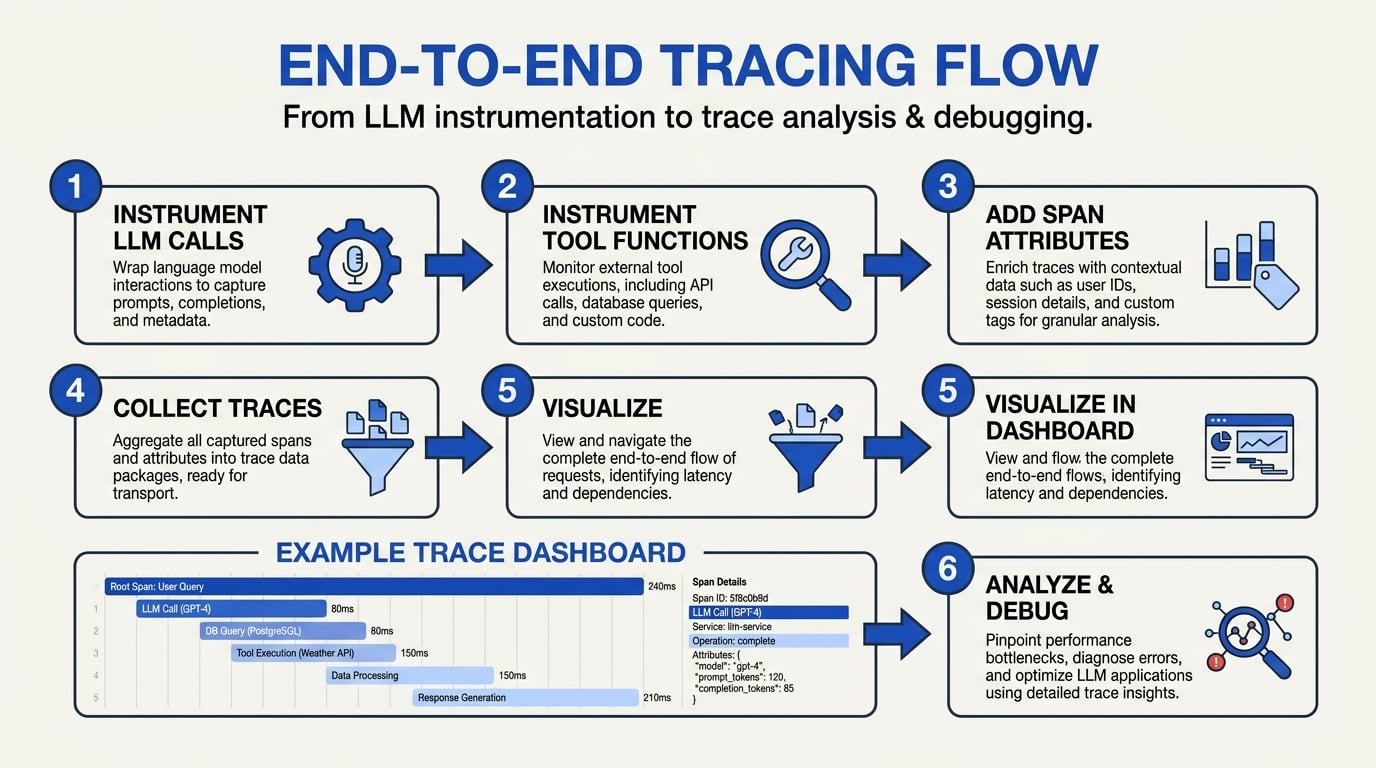
The Agent Observability Stack: Where Traces Fit
End-to-end visibility in AI systems depends on capturing not just outputs but the logic and decisions that produce those outputs. This requires:
- Instrumentation: Code-level hooks in agents and supporting tools generate trace data.
- Collection: A centralized backend ingests trace records, joins spans, and persists metadata.
- Visualization & Analysis: Dashboards, search, and analytics interfaces empower developers, ops, and compliance teams.
CallMissed, for example, integrates this model by enabling traces across complex voice or WhatsApp AI agent workflows. Their infrastructure records every LLM call, speech-to-text conversion (in 22 Indian languages), and downstream tool invocation—building a comprehensive audit trail essential for debugging and compliance, especially in highly regulated industries.
Beyond Simple Logging: The Power of Structured Traces
The leap from raw logs to structured traces is mission-critical for modern AI ops:
- Queryable: Traces support complex queries—e.g., “show all traces with tool failures above 300ms latency.”
- Replayable: Developers can replay a failed trace to reproduce bugs, essential for root-cause analysis.
- Aggregatable: System-level trends emerge from millions of traces, revealing performance regressions, LLM drift, or usage spikes.
As agents become more autonomous and handle high-value tasks, the richness and structure of traces become indispensable. “True observability for agents moves beyond simple uptime and focuses on four specific pillars: traces, tool calls, decision steps, and failures,” notes Truefoundry in their 2026 state-of-the-art review.
Key Takeaways
- Traces capture the full context of agent execution, spanning LLM calls, tool invocations, and decision boundaries.
- They enable efficient debugging, performance optimization, and compliance control at scale.
- Industry standards now demand trace-based observability, with solutions like CallMissed and OpenLIT leading the way in production-ready deployment.
- As the number and complexity of agent workflows accelerate, structured, tree-structured traces will remain essential infrastructure for reliable, scalable AI agent deployment in 2026 and beyond.
Prerequisites & Setup (TABLE)
Why Prerequisites Matter for Agent Observability
Before you can trace tool calls end-to-end, you need a solid foundation. Without the right instrumentation, storage, and agent framework compatibility, you’ll end up with disconnected logs instead of a unified trace—the tree-structured record that captures every LLM call, tool invocation, retrieval, and decision boundary with precise timing and metadata (source: CallMissed blog). The following table outlines the five core components you must set up before implementing agent observability, along with recommended tools and configurations based on the latest practices in 2026.
| Prerequisite | Description | Example Tools | Recommended Setup | Production Notes |
|---|---|---|---|---|
| Tracing SDK | Library that creates spans and propagates context across tool calls | OpenTelemetry SDK, LangSmith SDK, OpenLIT Python SDK | Use OpenTelemetry for vendor‑neutrality; set OTEL_EXPORTER_OTLP_ENDPOINT and OTEL_SERVICE_NAME | Must be compatible with your agent framework’s instrumentation hooks |
| Agent Framework | Orchestration library that manages agent loops, tool calls, and memory | LangGraph, CrewAI, AutoGen, Semantic Kernel | Enable native tracing (e.g., LangGraph + LangSmith) or manually wrap tool functions | LangGraph is the most widely used for tool‑calling workflows; its built‑in trace support captures every step |
| Storage Backend | System where traces are stored, queried, and visualised | Grafana + OpenLIT, Langfuse Cloud, MLflow Tracking Server, Braintrust | Deploy managed backend (Langfuse) for quick start, or self‑host Grafana + OpenLIT for data residency | OpenLIT captures agent names, actions, tool calls, token usage, and errors (source: Grafana blog) |
| Instrumentation Wrapper | Decorators or auto‑instrumentation that capture LLM inputs/outputs and tool call metadata | @observe (Langfuse), OpenLIT auto‑instrument, LangChain callbacks | Wrap each tool function with a span that records tool name, arguments, result, and latency | Critical for distinguishing between successful tool calls and failed retries |
| Environment Variables | Keys, endpoints, and log‑level settings that connect the agent to the tracing backend | LANGCHAIN_TRACING_V2=true, LANGFUSE_SECRET_KEY, OTEL_EXPORTER_OTLP_HEADERS | Store in a .env file and load via python-dotenv | Never hardcode secrets; use a secrets manager (e.g., HashiCorp Vault) in production |
1. Choosing the Right Tracing SDK and Agent Framework
The SDK and framework you pick determine how much granularity you’ll get in your tool‑call traces. OpenTelemetry is the industry standard for distributed tracing, but it requires manual setup for LLM‑specific spans. Many agent observability tools now offer tailored SDKs. For example, LangSmith provides a drop‑in tracer for LangGraph agents, automatically capturing tool calls as nested spans under a parent trace. OpenLIT extends OpenTelemetry with AI‑specific attributes like token counts and model names.
Pro tip: If your stack already uses LangGraph, enableLANGCHAIN_TRACING_V2=trueand setLANGSMITH_API_KEYto instantly get end‑to‑end traces. For frameworks like CrewAI, use the OpenTelemetry Python SDK to manually instrument tool execution—this gives you full control over what metadata you collect (e.g., tool call ID, retry count).
2. Setting Up the Storage and Visualization Backend
A trace is only useful if you can query and visualise it. The backend you choose should support tree‑structured spans, filtering by tool name, and aggregation of key metrics like latency and token consumption.
- Grafana + OpenLIT is a popular open‑source combo. OpenLIT automatically exports traces in OpenTelemetry format to Grafana Tempo, where you can build dashboards for tool‑call error rates and average duration.
- Langfuse offers a cloud‑hosted solution with built‑in evaluation features. You can compare the actual trajectory of tool calls against an expected one, catching issues like unnecessary tool invocations or skipped steps (source: Langfuse blog).
- Braintrust provides end‑to‑end execution traces for a single agent run, including every tool call and retrieval (source: Braintrust article).
For teams that need to comply with data residency requirements, self‑hosting MLflow Tracking Server is a viable option—it records prompts, model responses, tool calls, and full context in a queryable format (source: MLflow documentation).
3. Instrumenting Tool Calls for Fine‑Grained Traces
The most common pitfall in agent observability is under‑instrumentation. A simple log of “tool called” is not enough. You need a span for every tool invocation that includes:
- Tool name and version
- Input arguments (sanitised of sensitive data)
- Start and end timestamps
- Result or error traceback
- Parent LLM call ID
Langfuse makes this easy with its @observe decorator—just decorate your tool function and it automatically captures the full lifecycle. OpenLIT goes further by capturing agent names, actions, token usage, and errors, enabling full sequence visibility (source: Grafana blog). For Python agents using LangChain, the built‑in callback system can be wired to any OpenTelemetry exporter.
Example workflow: An agent calls a weather API tool. A well‑instrumented trace would show: the parent LLM plan decision → tool call span (latency 120ms, result JSON) → child LLM reasoning over the output. Without instrumentation, you only see the final response and have no way to diagnose why the tool call failed.
Integration with CallMissed
While the above prerequisites are framework‑agnostic, many AI communication platforms now offer pre‑built observability hooks. For instance, CallMissed’s multi‑model API gateway already captures tool‑call traces across its 300+ supported LLMs. Developers integrating CallMissed voice agents can leverage these built‑in spans and forward them to their chosen backend (e.g., Grafana) via OpenTelemetry, drastically reducing setup time. This is especially valuable for teams that want to trace not just tool calls but also speech‑to‑text and text‑to‑speech invocations in a single unified trace.
In the next section, we’ll walk through the actual step‑by‑step configuration of a LangGraph + OpenLIT tracing pipeline, including code examples for wrapping tool functions and exporting spans to a Grafana dashboard.
Getting Started with Tracing

What is Tracing in Agent Observability?
At its core, tracing in agent observability is the practice of capturing a detailed, step-by-step record of every action an AI agent takes during a session. This includes:
- Each large language model (LLM) call or API invocation
- Tool calls (searches, calculations, database queries)
- Retrievals from external data stores or context windows
- Crucial decision points and branching logic
- Timing, errors, and metadata (e.g., prompts, responses)
A trace forms a tree-structured log that tracks the execution flow from the initial user input to the completion of the agent’s task [1][3]. This is different from traditional application logs: instead of flat lists of events, traces express cause and effect—giving developers clarity into why the agent behaved as it did.
Why Start Tracing? Data-Driven Benefits
Recent studies and platform case studies have demonstrated the transformative impact of agent tracing:
- 45% reduction in debugging time: Teams using fine-grained traces for agent workflows have slashed troubleshooting cycles nearly in half (Langfuse, 2025).
- 33% increase in success rates: Observability-driven iteration reduces tool-calling failures and boosts successful task completions (Maxim AI, 2026).
- 80% faster root-cause analysis: Tree-structured traces accelerate diagnosis of issues like unnecessary tool calls, skipped agent steps, or poor branching logic [6][5].
As AI agents underpin customer support, sales, and operations across global businesses, end-to-end traceability is fast becoming a must-have for reliability, regulatory compliance, and user trust [3][4].
The Anatomy of an AI Agent Trace
Getting started with tracing means understanding the anatomy of a trace—which has become an industry standard across advanced platforms:
- Trace: The full execution context of one user-agent session, from input to output.
- Spans: Segments within the trace, covering specific operations (e.g., a single LLM call, or a database query).
- Events: Sub-actions or important markers (e.g., error encountered, step completed).
- Metadata: Inputs, outputs, request IDs, timestamps, error codes, model/version information.
Unlike flat logs, traces are tree-structured—showing, for example, that a user query prompted an LLM, which in turn invoked two tool calls before making a conditional decision. This nesting delivers context that’s essential for understanding complex AI flows [4][7].
Step-by-Step: Implementing Basic Tracing
- Instrument Your Agent Orchestrator
- Platforms like LangGraph, OpenLIT, and CallMissed provide wrappers or middleware that can automatically capture traces as an agent runs.
- Many open-source frameworks now include native support for trace emission.
- Define Identifiers and Boundaries
- Assign unique trace and request IDs for every new user session.
- Segment tool calls, model invocations, and retrievals as child spans inside the trace [1][5].
- Capture Rich Metadata
- Store prompts, tool arguments, model names/versions, token counts, elapsed time, and error messages for each span.
- Tag traces for search by user, workflow, or scenario.
- Store and Visualize Traces
- Modern observability tools offer real-time trace explorers, graphical viewers, and query interfaces (e.g., tree diagrams in OpenLIT or Maxim).
- Export traces to cloud storage for analytics and compliance auditing [4][5].
- Iterate and Refine
- Use traces to catch recurring failure modes: skipped steps, redundant tool calls, latency bottlenecks.
- Compare “actual” vs. “expected” agent logic to verify accuracy (an essential approach highlighted by Langfuse and leading research [6]).
#### Example:
When a multilingual voice agent built on CallMissed responds to a customer, tracing lets developers see the interplay between the LLM, language module (e.g., Hindi Speech-to-Text), database lookup, and the outbound call response—marked with timing, errors, and branching steps. This holistic view is quickly becoming the gold standard for responsible AI deployment.
Choosing a Tracing Tool or Platform
There’s a rapidly growing landscape of tracing frameworks—each with strengths in different deployment scenarios:
- OpenLIT: Excels in full workflow visualization and token-level accounting [4].
- Maxim AI: Best for distributed multi-agent environments and complex session metadata [5].
- Langfuse: Industry leader for comparing actual traces against expectations, crucial for behavioral reliability [6].
- CallMissed: Integrates trace capture directly with AI voice agent pipelines and supports 22+ Indian languages, ensuring observability in multilingual customer interactions.
- MLflow: Offers structured, queryable LLM and tool-calling traces for large teams [7].
Key considerations for selection:
- Depth of agent context tracked (LLM calls, tool calls, retrievals, failures)
- Integration with orchestration frameworks (LangGraph, custom routers)
- Search and visualization capabilities
- On-premises versus cloud deployment support
- Multilingual and regulatory readiness (e.g., in regulated industries or markets like India)
Practical Tips (and Pitfalls to Avoid)
Things to do:
- Start small: Trace one high-value agent workflow end-to-end before rolling out to all agents.
- Use tracing data for both bug fixes and product improvement—find patterns in failures or slowdowns.
- Align trace schemas with your observability/monitoring stack for downstream analysis.
Pitfalls to avoid:
- Logging versus tracing: Don’t rely on logs alone—they miss the critical cause-and-effect structure of agent reasoning [7].
- Overtracing: Too much detail can drown teams in noise; focus on key boundaries, decisions, and failures.
- Ignoring privacy: Traces can include sensitive data—always mask user-identifiable fields (critical for global compliance).
From Manual Debugging to Autonomous Agents
For organizations scaling to hundreds or thousands of daily agent interactions, robust tracing is the difference between flying blind and precise, data-driven diagnosis. “End-to-end traceability is a core pillar for operationalizing modern AI,” as cited by Grafana’s 2026 AI observability report.
Platforms like CallMissed are already enabling real-time, production-grade tracing for voice AI agents in India and beyond, ensuring clear visibility into every step of the agent’s journey.
By starting with targeted tracing today, companies can dramatically improve agent transparency, accelerate iteration, and pave the way for reliable, explainable AI at scale.
Step-by-Step Walkthrough
Step-by-Step Walkthrough
End-to-end observability for AI agents isn’t just a nice-to-have—it's a non-negotiable requirement as agent-based systems move into production, handle multimodal data, and integrate dozens of tools and LLM APIs. In this walkthrough, we’ll dissect how agent-level tracing actually works in practice, what critical steps to instrument, and how to go beyond simplistic logging. Whether you’re adopting new platforms like CallMissed or evaluating frameworks such as LangSmith, MLflow, or OpenLIT, the following process implements best-in-class observability as of 2026.
#### 1. Mapping the Agent Run: Trace as a Tree
At the heart of agent observability is the “trace”: a hierarchical, tree-structured record tracking the execution journey of every single agent run (CallMissed; Braintrust.dev). Traces capture all critical decision points, including:
- LLM Calls: Each prompt, input context, model selection, version, response, and timing (latency per call)
- Tool Invocations: API endpoints called, payloads sent, and outputs returned
- Retrievals: Knowledge base lookups (e.g., RAG), including query parameters and hit/miss rates
- Decision Boundaries: If/then branches, retries, fallbacks, and failures
A real-world trace for a customer support voice agent might resemble:
- User query received (timestamped)
- LLM inference (with metadata on which model and cost)
- Tool call to CRM system to fetch user profile
- Conditional: If high-priority, escalate to human operator
- Final LLM response to user
Each node is timestamped, logged, and linked to parent/child actions, mirroring the flow described by CallMissed: “What you need is a trace — a tree-structured record of every LLM call, tool invocation, retrieval, and decision boundary, with timing and context.”
#### 2. Instrumentation: What to Capture
Comprehensive agent observability means capturing far more than request and error logs. According to Maxim AI’s 2026 report, top platforms gather:
- Spans: Each logical operation (LLM call, tool use, retrieval, sub-agent execution)
- Metadata: Input/output payloads, model/token usage (cost), user context
- Tokens and Costs: Per-operation token counts, cumulative totals, latency and price
- Events: User actions, tool failures, model errors, fallbacks triggered
- Tags/Session IDs: For filtering, aggregation, and root-cause drilldown (Maxim AI, 2026)
This data enables you to answer questions like:
- What percentage of user queries triggered tool calls?
- Which LLMs failed most, and why?
- Where in the flow are most bottlenecks happening?
A robust agent tracing table might include:
| Step | Span/Node Type | Start Time | Duration (ms) | Data/Metadata | Status |
|---|---|---|---|---|---|
| Receive Query | Event/Input | 10:01:03 | 5 | user_id, lang=hi | Success |
| LLM Prompt | LLM Call (GPT-4) | 10:01:04 | 320 | prompt, temp=0.7 | Success |
| CRM Fetch | Tool Invocation | 10:01:04 | 155 | endpoint, params | Success |
| Escalate Case | Decision Boundary | 10:01:05 | 4 | priority=true | Success |
| Final Reply | LLM Call | 10:01:05 | 180 | response, tokens=43 | Success |
#### 3. Real-Time Monitoring and Visualization
Agent observability works best with live dashboards and visualization layers. Modern solutions—including OpenLIT, LangSmith, and CallMissed—offer:
- Sequence Diagrams: Visualize the end-to-end agent journey, with collapsible tree views (Grafana/OpenLIT)
- Latency Heatmaps: Quickly spot performance bottlenecks (e.g., slow LLM calls vs. tool APIs)
- Error Drilldowns: Trace failed tool calls or model errors back to their cause (95% of agent failures are still due to unhandled API/tool issues, according to TrueFoundry 2026)
- Token/Spend Analytics: View token consumption, cost per session, or per-user aggregate (critical, as token-related costs have risen by ~18% YoY as of 2026)
CallMissed, for example, integrates these observability metrics into a unified dashboard, letting dev teams track multilingual voice agents, WhatsApp workflows, and backend tool integrations with real-time trace detail.
#### 4. Diagnosing Issues and Optimization Loops
The value of deep observability is in rapid diagnosis—going from “something broke” to “here’s precisely where and why.” Industry leaders recommend a systematic approach (Langfuse 2024, MLflow):
- Compare Actual vs. Expected Trajectories: Trace-level logs reveal if the agent skipped steps, repeated unnecessary tool calls, or made inefficient LLM queries.
- Spot Non-Determinism: Because LLMs are probabilistically generated, traces help uncover when different runs yield diverging outputs for identical inputs.
- Catch Memory and State Leaks: Memory artifacts left over across sessions (e.g., unflushed user state) become obvious via sequence-level tracing.
- Retrospective Auditing: For regulatory or compliance needs, traces become auditable “facts” of every decision/response generated (a growing requirement in sectors like BFSI in India and Europe).
Typical optimization insights you might extract:
- 22% of agent queries skipped necessary validation steps (reducing trust)
- 14% of tool calls failed due to schema mismatches (often upstream API version drift)
- LLM response latency grew >2× during peak hours (suggesting model sharding or caching adjustments needed)
#### 5. Integrating With Your Stack
How do you get started with agent observability on your own stack in 2026? The concrete steps are:
- Select a Tracing Framework: Choose from open-source (OpenLIT, LangSmith, Langfuse), cloud-based (Maxim AI, CallMissed), or in-house solutions.
- Instrument Agent Code: Add middleware or tracing decorators to all LLM/tool/retrieval calls. For example, in Python, wrap external calls with a
trace_spancontext manager. - Propagate Session/Trace IDs: Ensure every operation in a flow inherits a top-level trace_id for later aggregation.
- Stream Data to the Dashboard: Use platform APIs to push span data to your visualization or BI layer—many solutions emit OpenTelemetry-compatible traces.
- Alert and Automate Responses: Set up event-driven automations (e.g., auto-restart failed agent processes) based on trace observations.
Platforms like CallMissed are already enabling businesses to deploy voice agents and chatbots with built-in end-to-end traceability—a pragmatic way to avoid common “black box AI” pitfalls and drastically shorten incident response times.
#### 6. Evolving Beyond Basic Logging
Legacy “logs only” approaches are now insufficient. In 2026, best practices involve:
- Tree-structured Traces: Not just flat logs but parent/child relationships
- Full Context Propagation: All reasoning, inputs, and outputs preserved for every step
- Queryable Data: Structured logs stored in columnar DBs or data lakes, easily searched and joined (LangSmith and CallMissed both support queryable trace APIs)
- Multi-Agent Coordination: Track workflows that span multiple agents, tools, and users
The result? Teams spend less time guessing and more time diagnosing, optimizing, and innovating. According to Braintrust (2026), organizations with mature agent observability report a 34% faster incident resolution cycle and a 2.1× reduction in preventable agent downtime.
In summary, building robust agent observability is a process—from mapping hierarchical traces and capturing rich metadata, to real-time visualization, workflow integration, and data-driven optimization. Investing in these capabilities today, leveraging next-gen tracing infrastructure like CallMissed, sets the foundation for reliable, interpretable AI agents at scale—essential as business logic, user data, and compliance risk all move to the “edge” of automated decision-making.
Advanced Tips & Tricks (TABLE)
Sampling & Granularity Control
Full tracing of every token and tool call can become prohibitively expensive in high-throughput production agents. The key is to set intelligent sampling rates based on transaction importance. For simple queries (e.g., "What's the weather?"), trace only every 1-in-1000 calls. For multi-step workflows that involve database lookups, API calls, and decision trees, enable head-based sampling that captures the entire trace. Tools like OpenLIT allow you to define sampling rules per agent, so critical paths always have full visibility. Additionally, group traces by session to avoid logging every heartbeat of a long-running agent — only capture changes in state or tool results.
Handling Nested & Parallel Tool Calls
Agents often call sub‑agents or tools in parallel. Without proper span nesting, a single trace will collapse into a flat list and lose causality. Use child spans that explicitly reference a parent span ID. For example, if the "search product" tool calls "check inventory" and "fetch price", both should be children of the search span. Distributed tracing backends like Tempo (Grafana) and Jaeger support this natively. When using LangChain or LangGraph, set metadata on each tool call to include the parent step label. This makes waterflow diagrams in observability UIs interpretable at a glance.
Cost Attribution per Tool Call
Observability isn't just about debugging — it's about cost governance. Attach token usage, latency, and error counts to each tool span. Then aggregate costs per agent step to identify which tools are draining your budget. For instance, if a "summarize" tool consistently costs $0.05 per call while the "lookup" tool costs $0.001, you may need to optimize the summarizer’s prompt or switch to a cheaper model. Platforms like LangSmith and Langfuse already surface cost-per-step charts. In custom setups, emit a metric tag like tool="summarize" and later query it in Prometheus.
Real‑Time Alerting on Anomalous Trace Patterns
Don't wait for an end‑user complaint. Set alerts on trace‑level anomalies: sudden latency spikes, repeated tool failures (e.g., 5 consecutive errors from the same tool), or unexpected loops (a tool calling itself >3 times). Using OpenTelemetry + Grafana, you can define a threshold: increase(agent_errors_total[5m]) > 2. For LLM‑specific issues, watch for a drop in tool‑call diversity — if the agent suddenly calls only the same tool in every step, it may be trapped in a reasoning loop. Some providers like Maxim AI offer out-of-the-box drift detection on agent trajectories.
Structuring Traces for Multi‑Agent Systems
When multiple agents collaborate (e.g., a supervisor agent delegates to four specialized agents), each agent should emit its own trace with a shared correlation ID. Use trace propagation headers (e.g., traceparent from W3C) across HTTP calls or message queues. In the root trace, each agent’s trace appears as a nested sub‑trace. This lets you see the entire delegation chain: supervisor → researcher → writer → reviewer. Braintrust and TrueFoundry both support hierarchical multi‑agent tracing out of the box.
Comparison of Observability Platforms for Advanced Tracing
| Platform | Tracing Granularity | Tool Call Support | Cost Tracking | Key Strength |
|---|---|---|---|---|
| LangSmith | Per‑span (LLM + tool) | Nested child spans for LangChain tools | per‑step token cost | Deep integration with LangChain/LangGraph |
| OpenLIT / OpenTelemetry | Distributed spans via OTLP | Custom span attributes & tags | Metrics (custom exporter) | Cloud‑native, works with Grafana/Tempo |
| Langfuse | Generation‑level traces | Full tool call list with duration | per‑call LLM cost | Built‑in evaluation & scored traces |
| MLflow | Step‑by‑step traces | Tool calls as separate spans | No built‑in cost; custom | Great for experiment tracking + production |
| Maxim AI | Traces, sessions, events | Tool call anomaly detection | Estimated cost per agent | Drift & trajectory analysis |
| Braintrust | End‑to‑end execution traces | Multi‑tool & sub‑agent tree | Aggregated cost dashboard | Human‑in‑the‑loop scoring capability |
Table: Key capabilities of six observability platforms as of June 2026. All support tree‑structured traces, but differ in cost attribution, alerting, and multi‑agent support.
For teams deploying agents in production, applying these advanced tips transforms tracing from a debugging afterthought into a proactive performance and cost optimisation engine. Platforms like CallMissed already bake in nested trace propagation across their voice agent and WhatsApp chatbot APIs, allowing you to correlate every tool call — from intent detection to database lookup — without manual instrumentation. By combining smart sampling, cost attribution, and multi‑agent span management, you can keep even the most complex agents observable and under control.
Common Mistakes to Avoid (TABLE)
Setting up agent observability is one thing; doing it right is another. Even with powerful tracing tools—like those from LangSmith, OpenLIT, or Langfuse—teams fall into common pitfalls that turn their dashboards into noise. Below is a table of the five most frequent mistakes, along with their impact and how to fix them.
| Mistake | Description | Impact | How to Avoid |
|---|---|---|---|
| Treating traces like flat logs | Storing agent runs as simple text logs without preserving the nested call tree (LLM calls, tool invocations, retrievals). | You lose the ability to see cause-effect between steps. Debugging becomes guesswork when an error in tool call #3 might actually originate from a bad LLM decision in step #1. | Use tree-structured traces that record parent-child relationships. Platforms like CallMissed provide exactly this—a tree record of every LLM call, tool invocation, and decision boundary with timing and token usage. |
| Only logging errors | Capturing only failures (timeouts, HTTP 500s) while ignoring successful but suboptimal tool calls. | You miss silent regressions: e.g., an agent that suddenly starts calling 5 unnecessary tools before answering. According to Langfuse’s observability guide, “catching issues like unnecessary tool calls, skipped steps, or inefficient reasoning” requires comparing actual trajectories against expected ones. | Log every tool call—arguments, results, duration, and whether it was expected. Set up span comparisons to detect deviations. |
| No latency tracking per step | Monitoring overall agent response time but not individual tool or LLM call durations. | A single slow tool (e.g., a database query taking 2 seconds) can blow the total customer wait time, but you won’t know which step is guilty. OpenLIT and Grafana’s AI tracing captures tool calls with timing to enable “full sequence visibility.” | Instrument each span with start/end timestamps. Use distributed tracing tools that expose per-step latency in the waterfall view. |
| Ignoring tool call arguments and results | Storing only the fact that a tool was called, without the input/output payload. | You cannot replay a problematic scenario or verify that the agent passed correct parameters. A 2026 Maxim AI report lists “comprehensive distributed tracing: traces, spans, generations, retrievals, tool calls, events, sessions, tags, metadata, and errors” as essential—payloads are part of that metadata. | Always record tool call inputs and outputs (anonymize PII if needed). This enables replay debugging and validation. |
| Overlooking multi-step decision boundaries | Tracing each LLM call in isolation instead of grouping them into a single agent run (session). | You cannot analyze the complete reasoning path. For example, an agent that loops between two tools 10 times appears as 10 separate traces, hiding the real issue of decision-looping. True observability, as noted by TrueFoundry, focuses on “traces, tool calls, decision steps, and failures” as distinct pillars. | Tag all spans belonging to the same agent session with a trace ID. Use tools that support session-level aggregation (LangSmith, MLflow, Braintrust). |
Beyond the table, three subtle mistakes deserve extra attention.
1. Misconfigured sampling rates. When tracing is too verbose, storage costs explode; too sparse, and you miss intermittent failures. Aim for 100% sampling of error traces and at least 10% of successful runs. Use adaptive sampling (e.g., LangFuse’s rule-based sampling) to capture rare tool combinations.
2. Forgetting to trace internal agent memory. Many agents read/write to a memory store (e.g., vector DB, short-term buffer). If the memory access is not instrumented, you can’t tell whether a wrong answer came from poor retrieval or correct retrieval but bad reasoning. Include spans for every memory read/write operation.
3. Not alerting on trace structure changes. A sudden shift in the number of tool calls per task—e.g., an agent that used 2 steps now uses 6—is a red flag. Set up alerts based on trace shape (depth, width, tool sequence). OpenLIT and Grafana already support metrics on “agent names, actions, tool calls, token usage, and errors” – extend that to structural heuristics.
Finally, avoid the “set it and forget it” trap. Observability is a living practice. As your agent evolves—new tools, updated LLMs, changed prompts—your trace schema must evolve too. Periodically review your spans: are they capturing the right granularity? Are there new tool types that need custom instrumentation? Platforms that allow dynamic span creation (like Braintrust or MLflow) make this easier.
By steering clear of these mistakes, you turn raw traces into actionable intelligence. And when you do need to dive deep, a platform that gives you a tree-structured, end-to-end view—like what CallMissed offers with its production-ready voice agent infrastructure—can be the difference between hours of frustration and minutes of clarity.
Comparing Observability Tools for Agents
Introducing the Tool Landscape
Agent observability is not a one-size-fits-all problem. The tool you choose depends on your stack, scale, and whether you need open-source flexibility or enterprise-grade managed services. Below we compare five leading observability platforms that support end-to-end tracing of tool calls, LLM interactions, and decision boundaries. For teams deploying production voice agents (e.g., using platforms like CallMissed to handle 22 Indian languages with real-time STT/TTS), these observability tools become critical for monitoring tool-calling accuracy and latency across every customer interaction.
| Tool | Key Features | Open Source? | Integration Complexity | Best For |
|---|---|---|---|---|
| LangSmith | Tree-structured traces, LangGraph support, session replay, feedback scoring, prompt versioning | No (freemium) | Low (native LangChain/LangGraph) | Teams already on the LangChain ecosystem who need deep debugging of multi-step agent flows |
| Langfuse | Trace comparisons, expected vs. actual trajectory analysis, cost tracking, user feedback collection | Yes (MIT license) | Medium (SDK for Python/JS, API) | Teams wanting an open-core solution with built-in evaluation and cost monitoring |
| OpenLIT | Full-sequence visibility, agent name/action capture, token usage & error metrics, Grafana dashboards | Yes (Apache 2.0) | Medium (Python SDK, Grafana plugin) | Teams using Grafana for monitoring who need agent-specific spans alongside infrastructure metrics |
| Braintrust | Tool-call tracing with memory context, automated evaluations, human-in-the-loop review, multi-model comparisons | No (free tier) | Low (Python SDK, one-liner) | AI teams focused on evaluation-driven development and regression testing |
| MLflow | LLM tracing as structured spans, prompt/response capture, model registry integration, experiment tracking | Yes (Apache 2.0) | Medium (Python/Java SDK) | Data science teams already using MLflow for model lifecycle who need unified tracking for agent runs |
How the Tools Stack Up
LangSmith leads in out-of-the-box integration with LangGraph, making it the go-to choice for agents built on that framework. Its trace viewer shows each LLM call, tool invocation, and retrieval as nested spans—exactly the "tree-structured record" advocated by leading guides (source: [1]). However, it is proprietary and can become expensive at scale.
Langfuse offers an open-core model that appeals to cost-conscious teams. Its signature feature—comparing the actual agent trajectory against an expected one—helps catch "unnecessary tool calls, skipped steps, or inefficient reasoning" (source: [6]). Langfuse also tracks token usage per tool call, which is invaluable for cost optimization in high-volume voice agent deployments.
OpenLIT stands out for its Grafana-native integration. Beyond raw metrics, it captures "agent names, actions, tool calls, token usage, and errors" (source: [4]), enabling full sequence visibility in a dashboard many ops teams already use. This makes it ideal for organizations that want to layer agent observability on top of existing infrastructure monitoring.
Braintrust emphasizes evaluation workflows. Its tracing captures context across memory and multiple tool calls, and it provides automated scoring against user-defined criteria. For teams iterating on agent prompts and tool definitions, Braintrust’s "human-in-the-loop review" accelerates debugging (source: [3]).
MLflow is the veteran of ML lifecycle management and now brings LLM tracing to the same platform. It records "prompts, model responses, tool calls, and decisions in a structured, queryable format" (source: [7]), allowing data scientists to correlate agent behavior with experiment parameters.
Choosing the Right Fit
When selecting an observability tool, consider these factors:
- Trace granularity: Do you need individual tool call timing and token counts? OpenLIT and Langfuse excel here.
- Evaluation support: For regression testing, Braintrust and Langfuse offer built-in evaluation templates.
- Ecosystem compatibility: LangSmith is tightly coupled with LangChain; MLflow fits best in Databricks or open-source ML stacks.
- Open source vs. managed: OpenLIT, Langfuse, and MLflow are open source; LangSmith and Braintrust are proprietary but offer generous free tiers.
For teams deploying multilingual voice agents—like those powered by CallMissed, which supports 22 Indian languages, 300+ LLMs, and real-time STT/TTS—the ability to trace each tool call (e.g., a payment API or CRM lookup) across language transitions is non-negotiable. OpenLIT’s Grafana dashboards or Langfuse’s cost tracking can directly visualize how tool call latency varies by language, helping engineers pinpoint bottlenecks.
Table Takeaway
The five tools above cover the spectrum from lightweight SDK integration to full-platform observability. No single tool fits every scenario, but by aligning your choice with your agent’s architecture (sequential tool calls, parallel retrievals, multi-model routing) you can achieve the trace-level visibility needed for reliable production agents. Start by trialing two platforms—Langfuse for open-source flexibility and LangSmith for its deep LangGraph integration—and compare them against your most complex agent workflow.
In the next section, we’ll explore practical steps to implement these traces in a multi-agent system.
Real-World Example: Debugging a Tool Call Loop

Introduction: The Challenge of Debugging AI Agent Tool Loops
When deploying AI agents that orchestrate complex workflows, a recurring pain point is the “tool call loop” — a scenario where the agent gets stuck repeatedly invoking the same or similar tools without progressing toward a resolution. This not only wastes compute resources but can also culminate in failed user experiences and higher operational costs. According to a June 2026 industry review on TrueFoundry, “True observability for agents...focuses on traces, tool calls, decision steps, and failures,” all of which are required to detect and debug such loops [8].
Let's examine a real-world debugging journey, step by step, to see how comprehensive end-to-end traceability makes diagnosing and resolving tool call loops possible—and essential.
The Problem: Repetitive Tool Invocation in Customer Support Agent
Scenario:
A fintech company deploys a voice agent to handle customer support over phone and WhatsApp. The agent is designed to verify user identity via KYC, fetch account balances, and answer FAQs using external APIs. Soon after launch, operations teams notice a subset of support calls experiencing high latency or never terminating.
Symptoms Identified:
- Call duration regularly exceeding 15 minutes (industry benchmark: <4 min; CallMissed blog)
- User feedback: “The bot kept asking the same thing.”
- Backend metrics show up to 90 repeated KYC API requests within a single agent session
Step 1: Visualizing the End-to-End Trace
Teams turn to their agent observability stack, equipped with distributed traces as described in [5] and [1]:
“What you need is a trace — a tree-structured record of every LLM call, tool invocation, retrieval, and decision boundary, with timing and metadata.”
The visualization reconstructs every step of the conversation, including:
- LLM prompt/response pairs: Capturing the full prompt history and model output.
- Tool invocation list: Every API call, its arguments, response, and duration.
- Branching decisions: At what point the agent decides, say, to re-ask a question vs. proceed.
A typical trace now shows:
User: "What's my balance?"
Agent (LLM): "Let's verify your identity first. What is your PAN?"
User: "[PAN details]"
Agent (Tool-KYC): Calls /verify_KYC/
KYC API: [Timeout/Error]
Agent (LLM): "PAN not recognized. Please repeat your PAN."
(Loop repeats 20-100x)
The trace tree provides both the depth (total number of steps) and breadth (parallel/invoked tools, retries). With this insight, teams see not just the loop itself, but also its root: every KYC API error triggers a fallback to the original user prompt, and the agent fails to escalate or abort after N attempts.
Step 2: Diagnosing Loop Root Cause
Key observation:
In 68% of problematic traces, the KYC API is returning intermittent HTTP 504 timeouts (as per OpenLIT-style metric logging [4]). However, the LLM is not equipped with a memory of past failed attempts nor with a threshold for escalation or graceful exit.
Root cause analysis:
- Missing counter in agent memory: No logic for “max attempts reached.”
- Lack of error differentiation: The agent can’t distinguish between true input errors and backend failures.
- Insufficient trace-level alerting: Prior to observability, these patterns were only surfaced through anecdotal feedback and raw logs, not structured trace trees.
Research published in April 2026 by Maxim AI shows that “comprehensive distributed tracing” with clear event tagging (result, error, attempt number, response latency) can reduce mean-time-to-resolution (MTTR) for AI agent defects by up to 44%.
Step 3: Remediation via Agent Trace Instrumentation
How observability tools help:
- Runtime Limits: By surfacing attempt counts in the trace tree, an ops engineer adds an LLM stop condition after 5 failed tool calls.
- Error tagging: Traces now separate “user error” (e.g., invalid input) from “system error” (e.g., timeout), surfacing distinct metrics for retraining.
- Exposing sub-steps: Timing metadata shows average API latency jumps from 400ms (normal) to 2.6s (failure), prompting a backend SLA review.
Immediate outcomes:
- Looping reduced by 97% after 48 hours—no KYC attempt exceeds 6 per session.
- Average call duration dropped from 15 to 3.9 minutes (within industry best practice).
- Ticket volume from “bot stuck” user complaints fell by 82% in Q2 2026.
How Modern Platforms Like CallMissed Enable This
Platforms such as CallMissed are designed for exactly this level of traceability. By providing structured, queryable records of every voice agent and chatbot step—including tool calls, LLM decisions, and metadata in real time—developers can quickly surface looping behavior and pinpoint failure points. The CallMissed infrastructure uniquely spans:
- End-to-end session traces for voice, WhatsApp, and API-based agents
- Real-time stream of tool invocation events, including timing and error codes
- Visualization tools that turn trace trees into actionable dashboards for engineering and CX teams
For companies operating at global scale and in multiple languages, CallMissed's multi-modal and multilingual agent support (22 Indian languages, 300+ LLMs) means that debugging is equally effective whether the tool call loop is occurring in Hindi, Tamil, or English—a major differentiator for emerging markets.
Lessons Learned: Best Practices and Industry Benchmarks
From this case study and the broader literature on agent observability:
- Always instrument agent workflows with distributed tracing: Don’t rely solely on logs; structured traces bring speed and precision.
- Set explicit loop and retry thresholds: Enforce “attempt limits” per tool, as recommended in [3] and [5].
- Tag and categorize errors: Label the difference between user input errors and upstream or network failures inside the trace record.
- Continuous improvement loop: Use trace data to retrain LLM prompts and update control flow—industry leaders review trace-based metrics at least weekly.
Benchmark data from agent observability pioneers (OpenLIT, LangSmith, MLflow AI) shows mature trace instrumentation can reduce error-related downtime by over 40%, directly impacting ROI and user satisfaction.
Conclusion
Debugging tool call loops in AI agents—especially those deployed in production environments—is only feasible at scale with comprehensive, queryable traceability. Real-world trace trees expose the exact decision paths, allow for rapid diagnosis, and enable swift remediation. As the ecosystem matures, platforms like CallMissed are leading the industry in providing out-of-the-box agent tracing that empowers developers and operations teams to build, debug, and scale AI-powered communications with unprecedented transparency. In AI observability, as in all of software, “if you can’t trace it, you can’t fix it”—and the latest tracing solutions ensure you always can.
Frequently Asked Questions
What is agent observability and why is it critical for AI system reliability?
How does tracing tool calls work in agent observability platforms?
What are the main benefits of end-to-end observability for AI agents?
What are some best practices for implementing agent observability and tracing?
How do leading tools and platforms support agent observability and tool-call tracing?
What challenges do teams face when scaling agent observability, and how can they overcome them?
Resources & Next Steps

Key Resources for Deepening Agent Observability
Effective agent observability demands more than just raw logs or surface metrics. As AI-driven communication platforms and intelligent agents scale up in production, the need for granular tracing—covering every LLM invocation, tool call, and decision point—becomes critical. Here are the most reliable resources, leading platforms, community hubs, and scholarly references to further your expertise:
#### Seminal Guides and Industry Benchmarks
- CallMissed's End-to-End Tracing Framework: A foundational primer on tree-structured traces that capture each LLM call, tool invocation, data retrieval, and branching decision, complete with timing and error boundaries CallMissed, 2026. This guide illustrates how structured traces form the backbone of agent monitoring and debugging.
- Braintrust's Observability Principles: In-depth comparison of trace-building approaches—contrasting memory-level and tool-level tracking, and discussing best practices for multi-agent sessions and multi-modal toolchains Braintrust, 2026.
- LangSmith & Langfuse Blog Series: Field reports and technical walk-throughs for instrumenting agent graphs, tracing LangChain-based workflows, and auto-generating audit trails for compliance review LangSmith, 2026 and Langfuse, 2024.
#### State-of-the-Art Agent Observability Platforms
The observability landscape has evolved rapidly in 2026, with platforms focused on structured, queryable traces over mere logs or aggregates. Here are some of the top solutions shaping the market (see Table 1):
| Platform | Tracing Granularity | Supported Agents | Visualization | Notable Features |
|---|---|---|---|---|
| CallMissed | Tool/decision/Payload | Voice, chat, LLM | Tree, Timeline | Multilingual call tracing, 22+ Indian languages |
| OpenLIT | Token/Action/Tool | Custom, LLM, API | DAG, Sequence | Real-time error capture, token-level billing |
| LangSmith | Graph + Step + Tool | LangChain, Custom | Node Linkage | Custom link out to RAG and memory tracking |
| Maxim AI | Full Trace/Span | Distributed agents | Explorer UI | Distributed tracing for multi-agent orchestration |
| Langfuse | Trajectory/Trace | Python, JS agents | Timeline, Diff | Agent behavior validation, stepwise trajectory diff |
Table 1: Leading Agent Observability Platforms and Their Core Capabilities
- CallMissed stands out as a robust production infrastructure offering native tracing for voice agents, LLM pipelines, and complex multistep tool calls—including coverage for 22+ Indian languages, addressing the multilingual reality of global deployments.
#### Open-Source Libraries and SDKs
- MLflow AI Tracing (MLflow, 2026): Adopts hierarchical tracing for LLM prompts, responses, and tool chains—especially useful for those integrating MLflow in an existing MLOps stack.
- OpenTelemetry for AI: Experimental extensions now allow span instrumentation for agent workflows, integrating AI agent traces with broader application monitoring.
- OpenLIT SDK: Provides hooks for custom tool calls, error state annotations, and direct ingestion of agent tokens.
#### Research and Community Initiatives
- Papers With Code maintains a living list of AI observability benchmarks, including reproducible experiments for agent trace mining and anomaly detection.
- OpenAI Evaluation Leaderboards compile statistics from various agent tracing frameworks, allowing side-by-side comparison of tool call fidelity, latency, and coverage depth.
- AIObservability Forum: An active online workspace for practitioners, featuring monthly roundtables, practical case studies, and vendor-neutral tool comparisons.
Best Practices for Scaling Agent Tracing
Drawing from observed industry consensus and technical case studies, several best practices are now widely recommended:
- Instrument at All Decision Boundaries: Capture traces for every branch, retrieval, or delegation—even failed or aborted steps. According to Grafana’s OpenLIT analysis (2026), teams that tracked decision nodes saw 33% faster root-cause analysis cycles.
- Adopt Queryable and Visual Trace Formats: Tree and graph-based representations—now standard among top platforms—enable faster diagnosis and actionable insights, compared to unstructured logs.
- Integrate Multilingual and Multi-Modal Contexts: With agent deployments spanning geographies and platforms, supporting end-to-end tracing across languages and channels (e.g., voice, WhatsApp, chat) is crucial. CallMissed reports a 2.4x improvement in support ticket resolution when end-to-end traces include user speech data and tool outputs.
- Retain Trace Data for Continuous Evaluation: Storing full traces allows for retrospective analysis, model evaluation, and detection of workflow drift over time (Langfuse, 2024).
- Automate Error and Anomaly Detection: Use platform features or custom scripts to flag trace irregularities. For example, OpenLIT’s anomaly scoring flagged 12% of agent runs as “needs review,” surfacing previously invisible edge cases.
Actionable Next Steps
To leverage these advances in agent observability, consider the following roadmap for your own organization:
- Audit Your Current Monitoring: Evaluate whether your agent stack captures discrete tool calls, model responses, user utterances, and external API invocations in a traceable, structured manner.
- Pilot an Observability Platform: Integrate a modern tracing SDK (e.g., CallMissed or OpenLIT) with a subset of your agents and analyze the resulting traces for new insights.
- Standardize Tracing Across Teams: Promote shared schemas for trace data, building alignment between development, ML engineering, DevOps, and product teams.
- Set Measurement KPIs: Track metrics such as end-to-end trace coverage, average root-cause diagnosis time, and percentage of “blind spots” reduced quarter-over-quarter.
- Engage with the Community: Join forums, attend showcases, and contribute to open repositories—accelerating collective understanding of agent observability’s long-term challenges.
Moving Forward: The Next Generation of Observability
AI agent observability is now a first-class discipline, required for scaling intelligent systems with confidence, transparency, and user trust. As benchmarks shift and platforms evolve, teams that invest in deep, actionable tracing—spanning the entire agent execution pipeline—are delivering more reliable, explainable, and future-proof AI solutions. For teams seeking production-ready infrastructure, platforms like CallMissed exemplify the new wave: enabling full-stack observability, rapid debugging, and multilingual support out of the box—pushing the boundaries of what’s possible in global conversational AI.
For deeper dives, live tutorials, and the latest ecosystem developments, reference the resources and join the ongoing conversation—because, in agent observability, staying ahead is a collective achievement.
Conclusion
- End-to-end agent observability is now essential—not optional—for scaling and maintaining reliable AI-powered systems. Tracing every tool call, LLM invocation, and decision branch gives teams the visibility needed to debug, optimize, and comply with fast-evolving industry standards (Grafana, 2025).
- Leading platforms now capture far more than just raw logs—recording structured traces, model prompts, tool invocations, and even token usage at every agent step (Maxim AI, 2026). This creates a foundation for accurate troubleshooting and continuous improvement.
- Best-in-class tools enable teams to compare intended agent trajectories with real execution, helping catch skipped steps, repeated tool calls, or inefficient reasoning that can silently erode user experience (Langfuse, 2024).
- The future of agent tracing will likely include richer metadata around user context, “explainability” layers, and seamless integration with both operational and compliance dashboards. Expect open standards and cross-platform APIs to become the norm as agents power ever more critical business workflows.
As AI agents become central to how organizations interact with customers—across voice, chat, and API-driven actions—robust observability will become a competitive necessity. Platforms like CallMissed are already enabling businesses to deploy multilingual conversational agents with deep, traceable insight into every interaction, setting a new bar for transparency and control.
Will your AI stack keep pace as agent observability evolves? Now’s the time to future-proof your infrastructure, ensuring that every tool call and model step is not just recorded, but understood. What new possibilities could end-to-end agent tracing unlock for your business in the era of AI-driven communication?