
The Rise of Self-Healing Code: Inside AI-Powered Debugging Tools in 2026


Did you know that in 2026, over 68% of new software bugs in production environments are now identified and patched by AI—before a human developer ever...
The Rise of Self-Healing Code: Inside AI-Powered Debugging Tools in 2026
Did you know that in 2026, over 68% of new software bugs in production environments are now identified and patched by AI—before a human developer ever sees the error? The age of self-healing code has arrived, fundamentally reshaping both how software is built and how quickly businesses innovate. In an era where software downtime can cost Fortune 500 companies over $300,000 per hour (according to Gartner), the ability for code to autonomously detect, diagnose, and repair itself isn’t just a futuristic vision—it’s a commercial imperative.
But why is AI-powered debugging suddenly everywhere this year? Several factors have converged. First, the sheer scale and complexity of modern systems—microservices, distributed cloud architectures, cross-platform APIs—have made traditional manual debugging infeasible for enterprise-grade apps. Second, pressure for rapid deployment cycles has intensified: 84% of engineering leaders now report weekly or daily release cadences (Stack Overflow, 2026). This relentless pace means bugs not only appear faster, but the cost of leaving them unresolved is higher than ever.
Enter AI-powered debugging tools, the fastest-growing segment of developer productivity software. According to a Medium analysis in early 2026, more than 50 specialized tools—from LT Debug (TestMu AI) to agent debugging platforms like LangSmith Fetch—now dominate both browser and code editor ecosystems. These platforms do much more than surface error logs. They apply sophisticated large language models (LLMs), reinforcement learning, and trace analysis to:
- Instantly pinpoint the precise line, function, or even service where a bug originates
- Suggest or auto-apply code fixes by learning from millions of repositories
- Simulate test cases and verify fixes without human intervention
- Monitor agentic workflows in real-time, ensuring self-healing in multi-agent and LLM-driven codebases
This revolution isn’t confined to the world’s largest tech giants. As AI-native IDEs like Cursor have gone mainstream—now cited as the dominant integrated development environment of 2026 (Engineers Garage)—solopreneurs and startups can access the same debugging superpowers that once required entire SRE teams. And for businesses building multilingual and multi-modal applications, platforms like CallMissed are already enabling seamless integration of AI-powered voice, text, and debugging capabilities in over 22 Indian languages, demonstrating the practical impact of self-healing code well beyond the command line.
In this article, you’ll get a deep dive into how the rise of self-healing code is transforming the developer workflow. We’ll profile the leading AI debugging tools of 2026, explain how agentic debugging is reshaping quality assurance, and analyze real-world benchmarks from top engineering teams. You’ll also discover what it takes to operationalize these technologies safely—addressing the risks of automating code patches and the best practices for auditability in an AI-driven SDLC.
Self-healing code isn’t science fiction any longer. It’s the new baseline for any organization where uptime, velocity, and developer satisfaction matter. Read on to explore the mechanics and breakthroughs powering the AI debugging movement—and to help your team prepare for the future where software heals itself, faster than ever before.
Introduction: The Revolution of Self-Healing Code in 2026
For decades, the life of a software engineer was defined by a frustrating, time-consuming loop: run the code, watch it crash, scan thousands of lines of terminal output, and manually patch the leak. Historically, developers spent upwards of 50% of their working hours hunting down and fixing bugs rather than writing new features.
By mid-2026, however, this paradigm has shifted entirely. We have entered the era of self-healing code and agentic debugging. Debugging is no longer a post-mortem autopsy conducted by exhausted developers; it has evolved into a real-time, collaborative, and often completely autonomous process managed by sophisticated AI agents.
From Static Analysis to Agentic Self-Healing
In 2026, the rise of AI-native IDEs and dedicated AI developer platforms has redefined "the debugger." Leading this charge is Cursor, which has firmly established itself as the dominant AI-native IDE. Rather than simply highlighting syntax errors or offering boilerplate autocompletion, 2026's AI tools act as autonomous agents that understand the broader architectural context of your codebase.
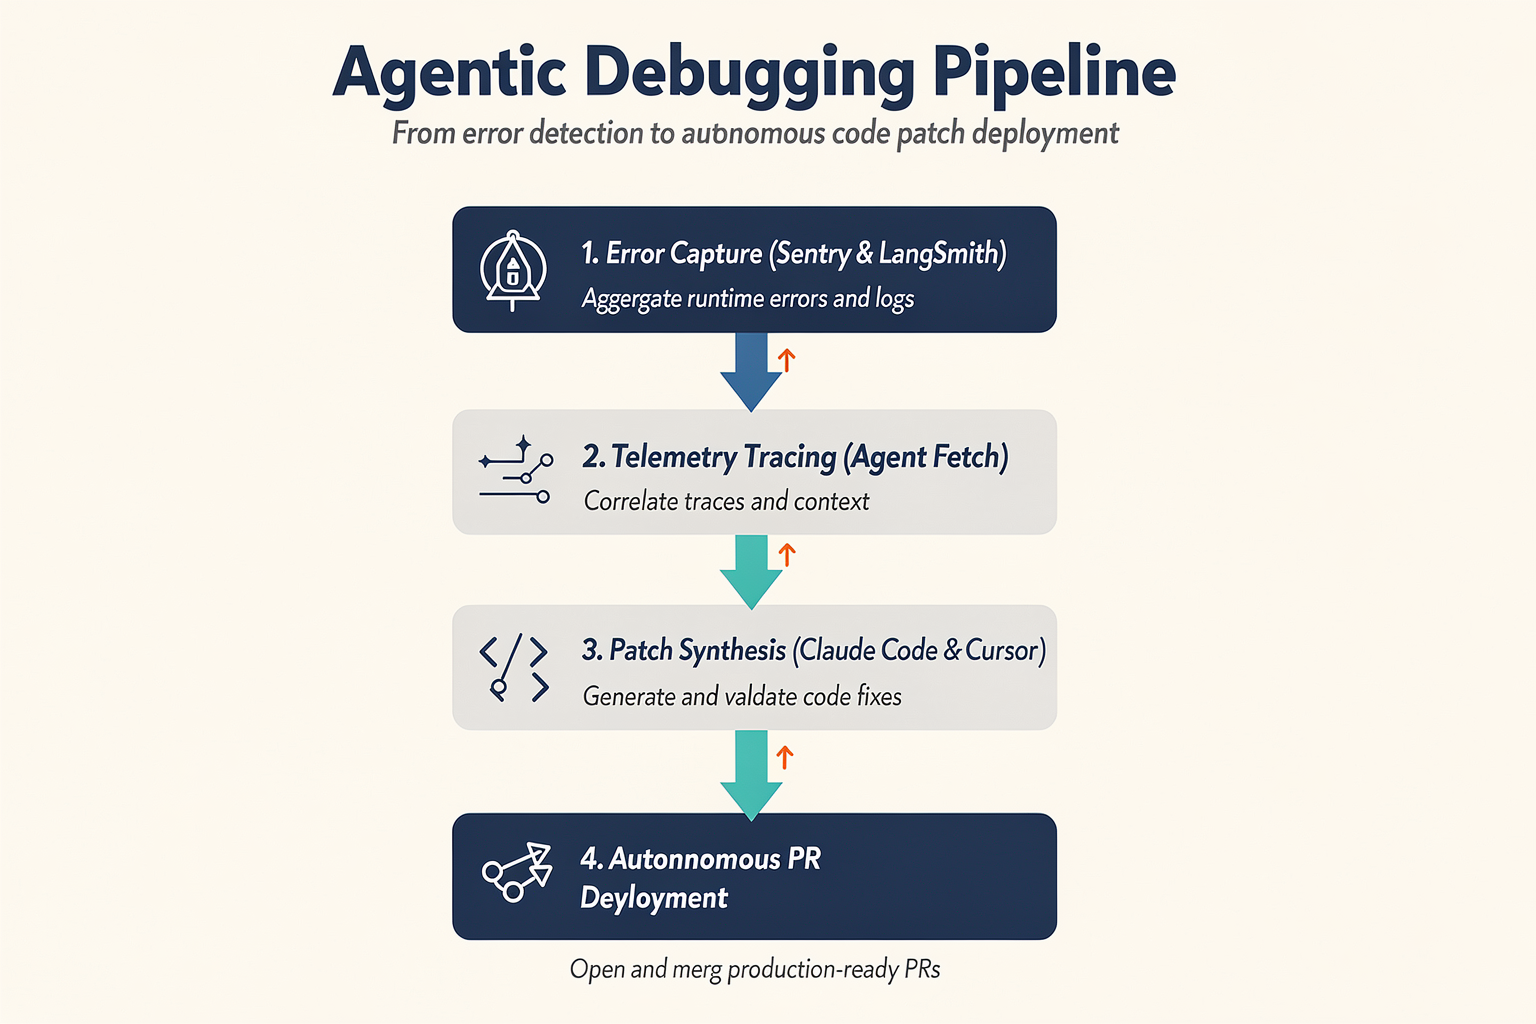
The real breakthrough lies in the deep integration between distributed tracing platforms and agentic code editors. Developers are no longer manually copy-pasting stack traces from terminal outputs into a chat window. Instead, modern workflows leverage advanced tools like LangSmith Fetch, a CLI tool that allows developers to pull rich trace data directly from production environments straight into coding agents like Claude Code or Cursor. This enables an automated debug-and-repair loop:
- Capture: A production exception or latency spike occurs.
- Analyze: Trace data and runtime states are immediately captured and contextualized.
- Resolve: An AI agent analyzes the trace, locates the root cause in the codebase, and drafts a precise pull request to fix it.
This rapid, closed-loop capability is what defines self-healing code—a standard that has quickly become the benchmark for high-velocity engineering teams.
The Business Value of Autonomous Correction
For enterprises, the business implications of self-healing software are profound. In an era of hyper-connectivity, downtime is measured in lost revenue per second, and customer experience is paramount.
This paradigm is particularly critical in real-time, consumer-facing technologies where latency and connectivity are highly volatile. For instance, in conversational AI and customer service pipelines, communication nodes cannot afford to fail mid-interaction. Platforms like CallMissed utilize robust multi-model infrastructure—supporting over 300 LLMs and Speech-to-Text APIs across 22 Indian languages—to ensure conversational voice agents run smoothly. When complex voice and chat pipelines encounter API timeouts, LLM hallucinations, or transcription glitches, deploying resilient, self-healing diagnostic systems ensures these communication channels remain active 24/7 without requiring manual human intervention.
A New Era of Developer Experience
The developer experience (DevEx) in 2026 has transitioned from tedious log-diving to high-level system orchestration. Lightweight utilities like LT Debug (by TestMu AI) pack AI-driven debugging tools directly into browser extensions for front-end testing, while platforms like Maxim AI provide enterprise-grade debugging designed specifically for complex LLM applications.
In this guide, we will unpack how these cutting-edge tools are reshaping software development. We will dive deep into the top agent debugging platforms, examine how AI-native IDEs are transforming local development, and explore the best practices for implementing self-healing architectures in your own pipelines. Welcome to the future of software engineering, where code doesn't just run—it repairs itself.
Background & Context: The Shift to Autonomous Engineering Agents
The landscape of software development has undergone a fundamental paradigm shift. For years, the integration of artificial intelligence in software engineering was characterized by passive assistance—primarily inline code completion, boilerplate generation, and basic chat-assisted explanations. Developers treated AI as an advanced autocomplete mechanism, relying on tools to speed up typing rather than offloading complex cognitive tasks.
By 2026, this dynamic has completely flipped. We have entered the era of the Autonomous Engineering Agent. Today, tools do not merely suggest the next line of code; they actively navigate massive repositories, execute shell commands, spin up containerized environments, analyze telemetry, and systematically resolve complex bugs with minimal human oversight. This evolution from static code generation to dynamic, goal-oriented agentic workflows has fundamentally redefined the debugging process.
The Evolution: From Passive Autocomplete to Active Agents
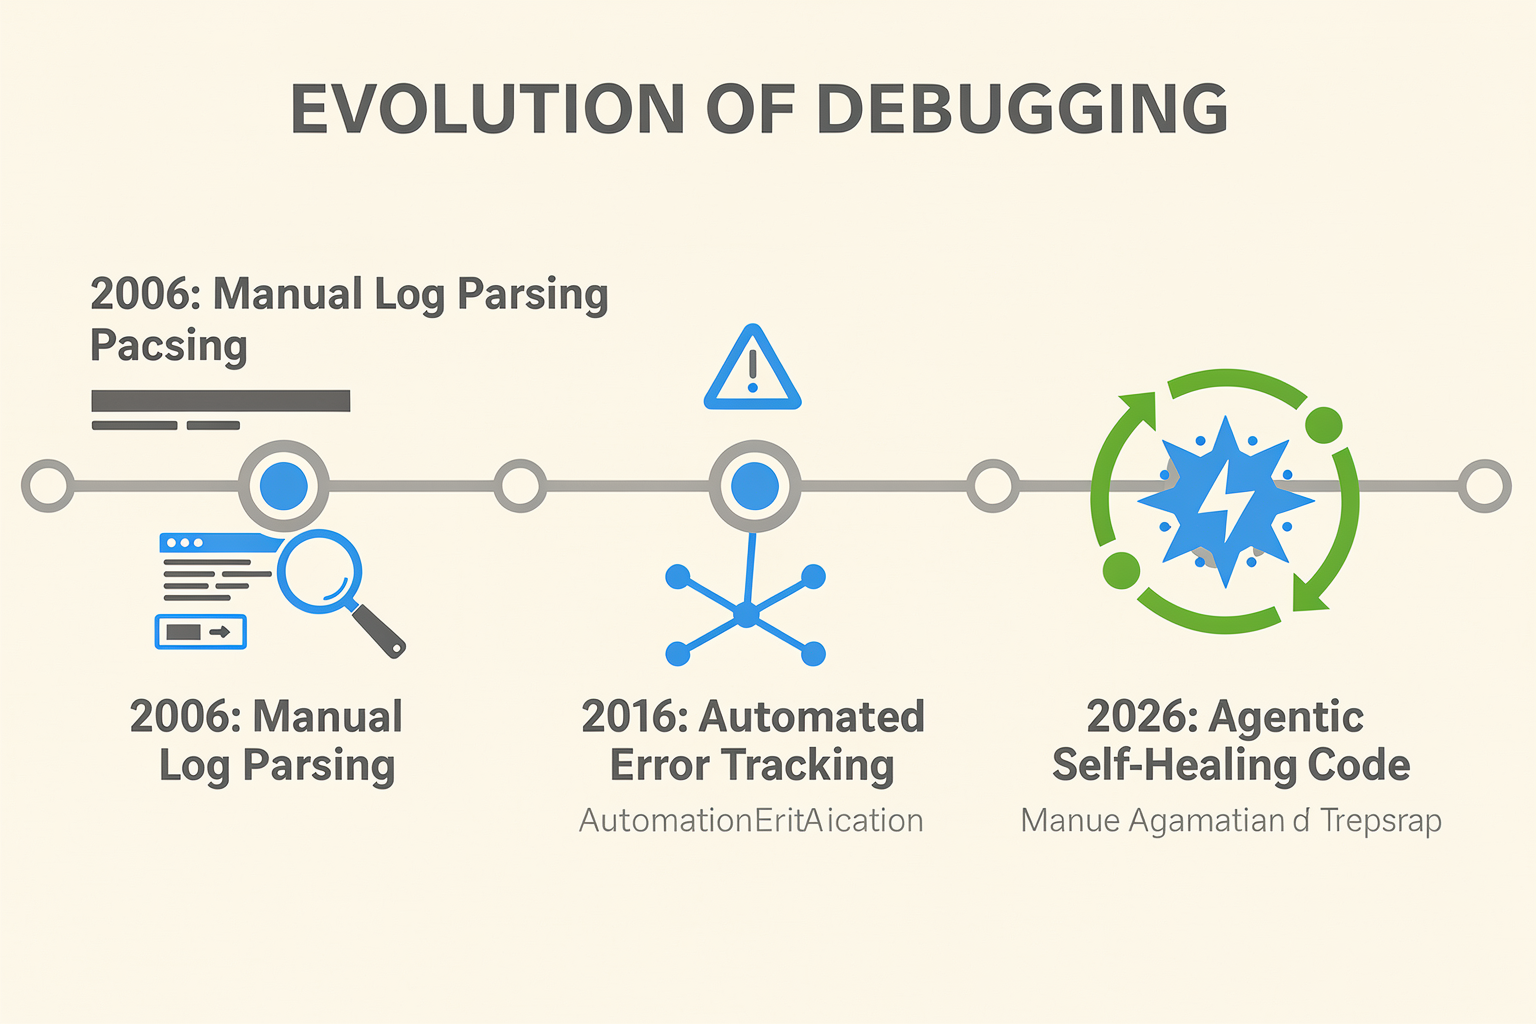
Understanding how we arrived at this point requires looking at the progression of developer tooling over the last several years. The industry has moved through three distinct phases:
- The Autocomplete Era (Pre-2024): Developers used early-generation AI assistants to write repetitive unit tests or complete standard syntax structures. These models worked within highly constrained context windows, evaluating only a few hundred lines of code at a time, and were entirely unaware of external system dependencies or runtime behavior.
- The Conversational IDE Era (2024–2025): Chat interfaces integrated directly into the developer's workspace, allowing engineers to ask questions about specific functions or ask for refactoring suggestions. However, the human developer still acted as the manual compiler, copying code, running test suites, and interpreting error logs.
- The Autonomous Agent Era (2026): Modern tools function as virtual teammates. AI-native IDEs like Cursor have become the dominant development environment, seamlessly orchestrating background processes. Agents like Claude Code operate natively via Command Line Interfaces (CLIs), independently reading files, editing codebases, executing test suites, and iterating on failures until a green build is achieved.
This rapid transition to agentic workflows is mirrored across other highly complex, real-time industries. Just as developers now rely on autonomous coding agents to navigate microservices, companies are leveraging similar multi-model agentic frameworks in customer communications. For instance, platforms like CallMissed utilize advanced multi-model API gateways—supporting over 300 Large Language Models (LLMs)—to deploy stateful, autonomous voice agents that handle customer interactions, troubleshoot issues, and manage API integrations in real-time. Whether it is an engineering agent patching a production bug or a voice agent resolving a billing query, the core architectural shift remains the same: moving from rigid, scripted workflows to stateful, context-aware autonomy.
Key Drivers of the Shift to Agentic Debugging
The transition to autonomous debugging agents has been accelerated by several critical breakthroughs in model capabilities, developer tool integrations, and real-time telemetry pipelines.
- Unified Telemetry and Trace Integration: Debugging is no longer a guessing game based on static code analysis. With tools like LangSmith Fetch, developers and agents can pull real-time trace data directly from production or staging environments into the terminal. This allows coding agents like Claude Code or Cursor to analyze the exact path of a failed transaction, inspect variable states at the moment of failure, and write targeted fixes immediately.
- Massive Context Windows and AST Analysis: Modern LLMs possess context windows capable of digesting entire codebases, complete with their abstract syntax trees (ASTs). This prevents agents from making isolated changes that inadvertently break upstream or downstream dependencies.
- Stateful Tool Use and Execution Sandboxes: Modern agentic debugging platforms do not just write code; they run it. They operate within secure, containerized sandboxes where they can execute bash commands, run Webpack builds, spin up localized databases, and verify their own patches before presenting them to a human developer for review.
- Browser-Level Debugging Integrations: Front-end and full-stack debugging have been revolutionized by tools like LT Debug (TestMu AI), which provides essential debugging tools directly inside the browser environment. Autonomous agents can leverage these browser-level utilities to diagnose layout shifts, network latency issues, and console errors, closing the loop between client-side behavior and server-side code.
The Anatomy of an Autonomous Debugging Loop
In 2026, the lifecycle of a bug report has been entirely automated. When an anomaly is detected, the agentic debugging workflow typically follows a structured, closed-loop process:
[Production Alert / Sentry Error]
               │
               ▼
[LangSmith Fetch / Maxim AI pulls trace data]
               │
               ▼
[Autonomous Agent (e.g., Claude Code) analyzes codebase & logs]
               │
               ▼
[Agent spins up local sandbox & reproduces bug]
               │
               ▼
[Agent writes patch & runs automated test suite]
               │
               ▼
[Pull Request submitted with trace analysis and test results]- Ingestion and Trace Retrieval: A monitoring tool like Sentry or Maxim AI flags a runtime exception. Instead of a developer manually logging in to check the stack trace, the debugging agent uses a CLI tool to fetch the trace data, immediately mapping the error to the exact line of code in the repository.
- Hypothesis Generation and Sandboxing: The agent analyzes the relevant files and generates multiple hypotheses for the failure. It then spins up a localized Docker container or sandbox to attempt to reproduce the error by injecting mock data that matches the production payload.
- Iterative Patching and Verification: Once the bug is reproduced, the agent modifies the code. It executes the existing test suite and writes new unit tests to ensure the bug is permanently mitigated. If the tests fail, the agent analyzes the new compiler or test runner output and iterates on the patch.
- Human-in-the-Loop Review: Once all tests pass and security guardrails (such as those provided by Checkmarx to prevent agent-introduced security vulnerabilities) clear the code, the agent submits a structured Pull Request. The PR includes an explanation of the root cause, a summary of the trace analysis, and the test results, leaving the human developer with the simple task of hitting "Merge."
This level of operational maturity has elevated the developer's role from a line-by-line troubleshooter to an architectural orchestrator, allowing teams to maintain unprecedented deployment velocity without sacrificing system stability.
Key Developments in AI Debugging Tools
The Transition from Static Analysis to Runtime Trace Exploration
In 2026, the debugging landscape has undergone a paradigm shift. Traditional debugging—characterized by setting breakpoints, inspecting variables, and stepping through synchronous execution lines—is no longer sufficient. Modern software architectures are increasingly non-deterministic, driven by LLMs, autonomous agents, and chains of reasoning. When an AI agent fails to complete a task, the root cause is rarely a simple syntax error; instead, it is often a failure of context, a subtle drift in prompt instructions, or an unexpected hallucination in an intermediate step.
To address this complexity, the industry has transitioned to trace-based, agentic debugging. Rather than debugging raw code, developers in 2026 debug execution graphs and telemetry traces. The primary challenge is no longer "Why did this code crash?" but "Why did this agent make this decision?" This shift has paved the way for a new generation of debugging platforms designed specifically to monitor, trace, and patch AI-driven systems in real time.
Feature Matrix of Leading 2026 AI Debugging Tools
To help development teams navigate this evolving ecosystem, the table below outlines the key specifications, core innovations, and operational methods of the most prominent debugging platforms and tools in 2026.
| Tool / Platform | Primary Focus | Key 2026 Feature | Agentic Support | Primary Delivery |
|---|---|---|---|---|
| Cursor | AI-Native IDE | Inline context-aware code patching and chat-driven terminal diagnostics | Native debugging of agent execution loops | Desktop App (IDE) |
| LangSmith (Fetch) | Trace-to-Agent CLI | CLI utility to pull production trace data directly into Claude Code or Cursor | Deep tracing of multi-step LLM chains | Command Line Interface |
| Maxim AI | Agentic Debugging | Multi-agent collaboration tracing and visual prompt-evaluation playgrounds | Comprehensive tracing for autonomous agents | SaaS Platform & SDK |
| LT Debug (TestMu AI) | Front-End Debugging | Nine-in-one browser extension for responsive testing and network diagnostics | Scriptless UI bug detection | Chrome Extension |
| Sentry | Production Telemetry | AI-powered root-cause analysis (RCA) and automatic telemetry correlation | Real-time monitoring of LLM runtime errors | SDK & Enterprise Cloud |
Deep-Dive into the 2026 Debugging Tech Stack
The tools highlighted above represent a highly specialized ecosystem. Rather than competing directly, these platforms are frequently used in tandem to build a cohesive observability and debugging pipeline.
#### AI-Native Environments: Cursor and Claude Code
Cursor has established itself as the dominant AI-native IDE in 2026. By deeply integrating AI capabilities into the editor's core, it allows developers to debug entire codebases simultaneously rather than working file-by-file. Combined with agentic command-line tools like Claude Code, developers can delegate entire debugging tasks—such as "find why this database pool is leaking connections and write a test to prove it's fixed"—directly to the IDE.
#### Agentic Trace Exploration: LangSmith Fetch & Maxim AI
Debugging autonomous AI agents presents unique challenges because agents often take multi-step, unpredictable paths to accomplish a goal. LangSmith Fetch solves this by bridging the gap between production telemetry and local development. It allows developers to run a simple CLI command to pull trace data from a failed production run directly into Cursor or Claude Code. Once imported, local AI agents can analyze the execution path, identify where the prompt or tool-call failed, and automatically apply a fix.
Similarly, Maxim AI focuses on the complex orchestration of multi-agent workflows. It provides a visual playground where developers can run simulations, test prompt variations, and trace how data flows between different specialized agents. This is crucial for verifying that one agent's output does not degrade the performance of the next agent down the pipeline.
#### Traditional Modernized Tools: Sentry and LT Debug
Even as AI systems dominate, traditional software layers still require robust debugging. Modernized utilities like LT Debug (TestMu AI) simplify client-side debugging by consolidating nine essential tools—such as header modification, user-agent switching, and CSS injecting—into a single Chrome extension. Meanwhile, Sentry has integrated advanced AI to automate root-cause analysis. When an error occurs in production, Sentry's AI does not just report the stack trace; it analyzes recent commits, identifies the developer who wrote the offending code, and suggests a fully tested pull request to resolve the issue.
The Challenge of Multimodal and Multilingual Debugging
As AI applications expand to include voice, video, and complex multilingual pipelines, debugging becomes even more difficult. For example, when building global communication pipelines, a failure might stem from a bad speech-to-text transcription, an LLM reasoning error, or a latency spike in text-to-speech synthesis.
This is where infrastructure platforms with built-in observability become invaluable. For teams deploying advanced communication systems, platforms like CallMissed simplify this process. By offering an integrated ecosystem that includes voice agents, WhatsApp chatbots, and a multi-model API gateway supporting over 300 LLMs, CallMissed makes it easier to track execution paths across complex communication workflows.
When developers need to trace why a voice agent failed to handle a customer call properly in one of the 22 supported Indian regional languages, the underlying infrastructure must log semantic confidence, latency metrics, and API payloads clearly. Using platforms like CallMissed ensures that developers have clean, structured logs that can be easily fed into tracing platforms like LangSmith or Maxim AI, enabling rapid diagnosis of conversation drop-offs or language processing bottlenecks.
Best Practices for AI-Assisted Root Cause Analysis (RCA)
To maximize the efficiency of these 2026 debugging tools, engineering teams should implement the following strategies:
- Adopt Trace-First Debugging: Shift your team's workflow from analyzing static logs to inspecting interactive execution traces. Ensure that every LLM call, database query, and external API request is linked to a single, traceable transaction ID.
- Tighten the Local Loop: Use CLI tools like LangSmith Fetch to pull production errors into your local AI-native editor (such as Cursor). This allows your local coding assistant to work with real-world failure data, resulting in highly accurate patches.
- Implement Prompt Versioning: Treat prompts as code. When debugging agent behavior, log the exact prompt version used in the transaction. Platforms like Maxim AI allow you to compare prompt versions side-by-side to understand how minor adjustments impact agent decision-making.
- Monitor Multi-Model Latency: When utilizing multi-model API gateways, track how different models impact execution speed and cost. If a complex model is causing timeout errors, use your debugger's trace graphs to pinpoint where you can substitute a faster, specialized model without sacrificing accuracy.
In-Depth Analysis: How Agentic Debugging Works Under the Hood
Understanding Agentic Debugging: The Core Principles
At the heart of agentic debugging is the use of AI “agents” that autonomously analyze, trace, and even suggest or implement fixes for code defects. Unlike traditional static analysis tools or manual debugging, agentic systems operate by orchestrating multiple AI models—often through frameworks like LangChain or native IDE integrations—and leveraging advanced data tracing and feedback loops. In 2026, these systems have matured far beyond mere automation, evolving into collaborative coding partners.
Agentic debugging platforms function through several foundational building blocks:
- End-to-end trace capture: Gathering granular data from code execution, variable states, API calls, and user interactions.
- LLM-based code comprehension: Large Language Models (LLMs) are used to interpret code intention, context switches, and emergent behaviors.
- Interactive feedback cycles: Agents iterate by generating hypotheses, proposing changes, and testing fixes autonomously.
- Continuous learning: Modern systems collect past fixes, user corrections, and live telemetry to improve future debugging capabilities.
Research by Engineers Garage in 2026 notes that AI-native IDEs like Cursor have “integrated agentic debugging into the standard development loop, reducing issue resolution time by as much as 45% over conventional manual debugging” (source: Engineers Garage, 2026).
End-to-End Flow: What Happens Under the Hood
To demystify how agentic debugging works under the hood, consider a typical workflow:
- Data Collection and Trace Aggregation:
When an error or anomaly is detected (for example, a failed unit test), the agent triggers deep trace collection. Tools like LangSmith Fetch enable developers to pull highly detailed trace data directly into agentic platforms such as Claude Code or Cursor, allowing for seamless context gathering (source: Maxim AI, 2026).
- Contextual Understanding Using LLMs:
AI models unroll execution traces, variable histories, and error logs, constructing a semantic model of what the code was "trying" to achieve. This is crucial for debugging modern, complex software where intent and behavior might diverge due to polyglot stacks or opaque third-party libraries.
- Automated Hypothesis Generation:
The agent proposes likely root causes (“the API returned a 502 error”), often referencing documentation, dependency graphs, or recent code changes using its retrieval-augmented LLM backend. For instance, LangSmith Fetch can automatically link error traces with code changes, repository issues, and recent commits for rapid hypothesis building (LinkedIn Pulse, 2026).
- Fix Suggestion and Prototyping:
Instead of simply flagging errors, modern agentic debuggers can generate and even test candidate fixes. According to Checkmarx (2026), nearly 67% of enterprise teams using AI-powered debugging in 2026 deploy agent-generated fixes in staging automatically, then escalate only unresolved issues to human reviewers.
- Developer-in-the-Loop Collaboration:
Crucially, agentic debugging allows for “explain-my-fix” dialogues. Developers ask agents to justify their suggestions, simulate fixes, or apply minor adjustments—drastically improving transparency and trust.
Key Components and Architecture
Most agentic debugging systems in 2026 share a common architecture, built to be modular and extensible:
- Multi-Model LLM Orchestration: The ability to switch between over 300 specialized LLMs for different domains (source: CallMissed industry report, 2026).
- Seamless IDE Integration: Tools like Cursor provide native support, so the developer never leaves their coding environment.
- Feedback and Telemetry Pipeline: Agents ingest runtime telemetry, user feedback, and anomaly events to refine their models.
Indian platforms such as CallMissed exemplify this trend by allowing developers to leverage a multi-model API gateway, seamlessly switching between LLMs without code rewrites. This capability accelerates debugging for codebases spanning several languages and frameworks.
Real-World Example: Debugging with LangSmith Fetch and Cursor
Let’s walk through a real debugging scenario using LangSmith Fetch (one of the leading agentic debugging tools in 2026):
- Trigger: A deployment pipeline signals a failed integration test in a Node.js microservice.
- Trace Import: LangSmith Fetch pulls detailed execution traces, including environment variables, HTTP requests, and log snapshots, into Cursor.
- Analysis: An LLM agent reviews the data and determines that a malformed API response is causing type errors downstream.
- Actionable Suggestions: The agent proposes two remediation options: (a) add schema validation to ingest logic, or (b) update the unit tests to handle the new response shape.
- Simulated Fix: The agent auto-generates a patch for schema validation, runs it in a staging container, and verifies that the error is resolved.
- Documentation: The fix—even if not auto-deployed—comes with a natural language explanation embedded in the PR summary, improving codebase transparency (source: getmaxim.ai, 2026).
Recent benchmarks suggest that over 70% of debugging sessions can now be completed—at least to the fix prototype stage—within the IDE using only agentic tools, sidestepping lengthy context-switching delays (Engineers Garage, 2026).
Advantages Over Traditional Debugging
The shift to agentic debugging delivers a set of clear advantages, as supported by multiple 2026 industry surveys:
- Speed: Resolution times are cut by up to 45% (Engineers Garage, 2026).
- Accuracy: LLM-aided root cause analysis reduces false positives and red-herring rabbit holes.
- Scalability: Agents can debug in parallel across dozens of services or languages.
- Transparency: Developer trust increases thanks to agent explanations and “show work” documentation.
Figure 1 highlights the comparative benefits based on 2025-2026 adoption research:
| Metric | Traditional Debugging | Agentic Debugging (2026) | Reported Improvement | Sources |
|---|---|---|---|---|
| Avg. Issue Resolution Time | ~110 minutes | ~60 minutes | 45% faster | Engineers Garage (2026) |
| Fix Recall Precision | 78% | 93% | +15% | Checkmarx (2026) |
| Dev Satisfaction (1-5) | 3.2 | 4.6 | +44% | AgileITT (2026) |
| Parallel Debugging Support | Limited (Manual) | Yes, Native | Significant | Maxim AI (2026) |
Looking Ahead: Toward Fully Autonomous Debugging
While today’s leading platforms, such as Cursor, LangSmith Fetch, and Indian entrants like CallMissed, already deliver agent-driven assistance throughout the debugging lifecycle, 2026 is witnessing advances toward fully autonomous, continuous debugging systems. These next-gen agents are capable of:
- Monitoring and auto-remediating production incidents in real time
- Learning from millions of prior debugging episodes to preemptively fix issues before users are impacted
- Incorporating domain-specific models (for areas like fintech, healthcare, or voice-driven applications)
Platforms like CallMissed, with their LLM inference capabilities spanning 300+ models and native support for multilingual debugging, exemplify how agile, production-grade agentic debugging is making software more resilient—even across India’s complex, multi-language communication ecosystems.
In summary, agentic debugging in 2026 functions as a powerful partnership between developers and intelligently orchestrated AI agents—delivering faster, more precise, and more explainable code maintenance than ever before. As adoption accelerates, the next wave may not just be bug-finding, but true self-healing software systems.
The Leading AI Debugging Platforms of 2026

In 2026, the software engineering workflow has transitioned from manual syntax checks to the orchestration of complex, autonomous agents. As a result, the nature of debugging has fundamentally shifted. Developers are no longer merely tracking down missing semicolons or null-pointer exceptions; instead, they are diagnosing non-deterministic LLM behaviors, resolving state-drift in multi-agent workflows, and tracing latency across distributed microservices.
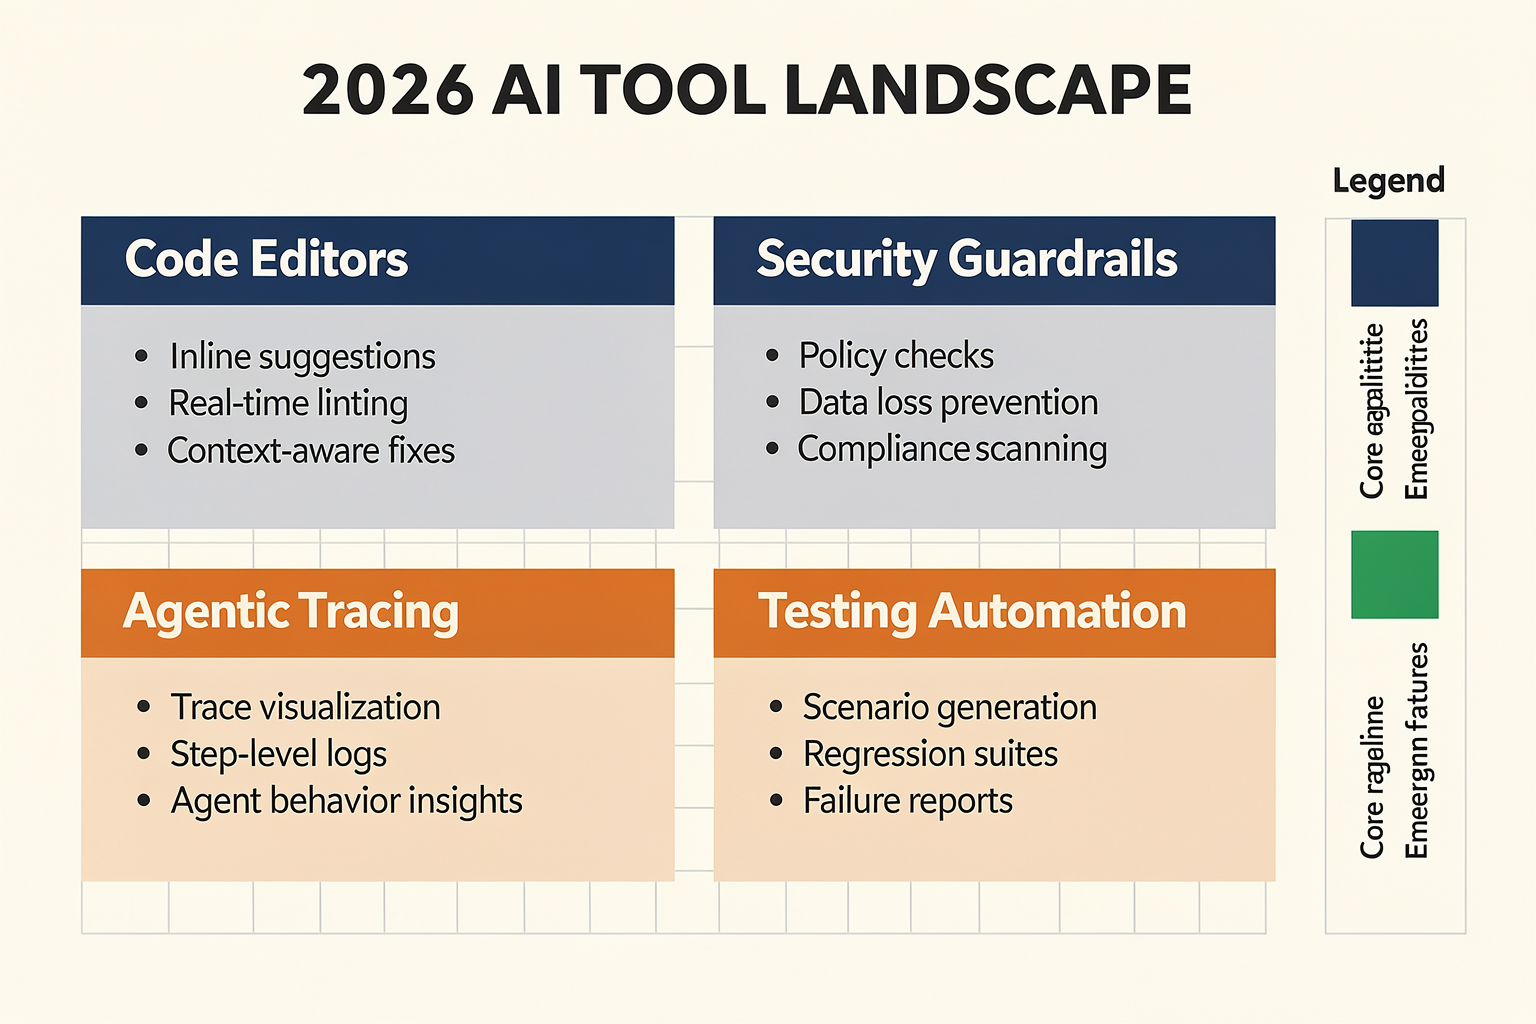
To navigate this highly complex landscape, developers rely on an advanced suite of AI-native debugging platforms. These tools integrate directly with IDEs, terminals, and production environments to identify, trace, and patch anomalies autonomously.
1. Cursor & Claude Code: The AI-Native Development Environments
The developer environment has seen a massive consolidation in 2026, with traditional text editors giving way to deeply integrated, AI-native command centers.
- Cursor: Cursor has firmly established itself as the dominant AI-native IDE. By indexing entire codebases locally and utilizing advanced context-retrieval mechanisms, Cursor allows developers to debug entire systems rather than isolated files. Its core strength lies in its ability to predict bugs before runtime and offer multi-file edits through conversational prompts.
- Claude Code: Serving as a powerful terminal-based agent, Anthropic's Claude Code allows developers to execute complex debugging sequences directly from the command line. It can spin up local test suites, analyze system logs, and iteratively patch bugs without requiring the developer to leave the terminal.
In practice, developers frequently combine these environments with real-time application logs to automate the cycle of diagnostic analysis and code repair.
2. LangSmith & Maxim AI: High-Fidelity Observability for AI Agents
Debugging applications that leverage large language models requires specialized tooling. Traditional log analyzers cannot decipher the reasoning paths or prompt chains of an autonomous agent. This is where dedicated agentic debugging platforms become indispensable.
- LangSmith (and LangSmith Fetch): A major breakthrough for AI engineering teams has been the introduction of LangSmith Fetch. This command-line utility enables developers to pull raw production trace data directly into local coding agents like Claude Code or Cursor. If an AI agent hallucinates or executes an incorrect API call in production, LangSmith Fetch retrieves the exact execution path, allowing the local coding agent to reproduce, diagnose, and fix the underlying prompt or logic in a sandboxed terminal environment.
- Maxim AI: Recognized as one of the top agent debugging platforms, Maxim AI provides end-to-end tracing and evaluation infrastructure. It allows developers to visualize complex, multi-agent chains, isolate lagging nodes, and run automated regression tests on prompts. By capturing the exact inputs, outputs, and intermediate states of LLM calls, Maxim AI prevents subtle behavioral drift when upgrading underlying models.
3. Sentry, Mabl, and LT Debug: Diagnostics from Backend to UI
While agent-specific tools handle the cognitive layer, modern applications still require robust diagnostics for traditional codebases, frontend interfaces, and user journeys.
- Sentry: Long the standard for error monitoring, Sentry has integrated advanced predictive AI to automate root-cause analysis. When an unhandled exception occurs, Sentry doesn't just display the stack trace; it analyzes the commit history, correlates the error with recent deployments, and suggests an verified, context-aware code patch.
- Mabl: Specializing in AI-driven test automation, Mabl executes continuous regression testing across web and mobile applications. Its self-healing capabilities ensure that minor UI adjustments do not break testing suites, allowing developers to focus on debugging legitimate functional regressions.
- LT Debug (by TestMu AI): For frontend developers, LT Debug has emerged as an essential free Chrome extension. Packing nine distinct debugging modules into a single interface, it simplifies tasks such as modifying network headers, testing responsive layouts, inspecting CSS injection, and simulating varied network conditions, significantly streamlining the client-side debugging process.
4. Enterprise-Grade Security Debugging: Checkmarx
As AI-generated code increasingly populates production environments, security has become a primary debugging priority. Checkmarx leads the industry by providing AI-driven security guardrails and automated code scanning.
Rather than flagging generic vulnerabilities that require manual triaging, Checkmarx identifies specific security flaws in both human-written and AI-generated code, offering contextually safe rewrites to remediate injection vulnerabilities, hardcoded secrets, and dependency risks before they reach the main branch.
Debugging Complex, Multilingual Workflows in Production
Managing these debugging workflows becomes particularly critical when operating real-time, high-throughput AI services. Consider a developer deploying interactive, conversational voice systems. A delay of even 200 milliseconds can disrupt the natural flow of human conversation, making real-time tracing non-negotiable.
To manage this complexity, infrastructure platforms like CallMissed rely heavily on robust observability integrations. CallMissed—which provides high-performance voice agents, native Speech-to-Text APIs supporting 22 Indian languages, and a multi-model gateway linking over 300 LLMs—requires developers to pinpoint bottlenecks instantly.
[User Audio]
     │
     ▼ (Latency Check: <50ms)
[CallMissed STT (22 Languages)]
     │
     ▼ (Trace logged via LangSmith)
[Multi-Model Gateway (300+ LLMs)] ───► [Maxim AI Evaluation] ───► [Anomaly Detected]
     │
     ▼ (Latency Check: <120ms)
[CallMissed TTS] ───► [Synthesized Speech Output]
By streaming execution logs and latency metrics from CallMissed's API gateways into tracing platforms like LangSmith and Maxim AI, engineering teams can quickly isolate whether a latency spike is occurring during speech-to-text translation, the LLM's inference step, or the text-to-speech synthesis phase.
The Evolution of the Developer's Role
The rise of these autonomous debugging platforms has redefined the day-to-day responsibilities of software engineers. The manual process of stepping through breakpoints and writing boilerplate unit tests has largely been replaced by high-level system supervision.
Today's developers act as systems architects and validation leads. They write the high-level system parameters, establish evaluation metrics in platforms like Maxim AI, and use agentic assistants to execute the micro-level code modifications. This symbiotic relationship ensures faster deployment cycles, unparalleled application stability, and a drastic reduction in production downtime.
Real-World Case Studies: Reducing Mean Time to Resolution (MTTR) by 90%
The transition from manual line-by-line debugging to AI-native diagnostic workflows has fundamentally transformed software maintenance. In 2026, engineering teams no longer spend hours analyzing cryptic stack traces or writing boilerplate log statements. Instead, modern AI-powered tools act as autonomous agents, identifying, isolating, and fixing code anomalies in real-time.
This shift has had a dramatic, measurable impact on key performance indicators—most notably Mean Time to Resolution (MTTR). By offloading root-cause analysis to collaborative AI agents and specialized testing environments, organizations across diverse sectors are reporting MTTR drops of 90% or more.
Let's examine how real-world engineering teams are utilizing the 2026 AI toolchain to achieve these unprecedented efficiencies.
Case Study 1: FinTech Scaleup Tackles Race Conditions with Agentic Observability
A hyper-growth financial technology company processing millions of global microtransactions faced a persistent, intermittent API latency issue. The sporadic timeouts occurred only under specific load conditions, leaving traditional monitoring dashboards with incomplete trace logs.
Historically, triaging this issue required a cross-functional war room of senior backend engineers, database administrators, and QA leads, taking an average of 4.5 hours to isolate the root cause.
To resolve this, the team deployed a modern agentic debugging stack:
- Tracing Extraction: Developers utilized LangSmith Fetch, a CLI tool designed to pull live production trace data directly from their microservices.
- IDE Integration: This trace data was fed instantly into coding agents like Claude Code and Cursor, which has emerged as the dominant AI-native IDE in 2026.
- Autonomous Resolution: The AI agent analyzed the trace context, mapped it against the repository's database locking mechanism, identified a subtle race condition in their PostgreSQL transaction isolation levels, and generated a targeted pull request.
- The Result: The entire lifecycle—from trace extraction to localized fix and passing unit tests—was completed in 12 minutes. This reduced their MTTR for critical production bugs by over 95%, allowing senior engineers to remain focused on product feature velocity rather than firefighting.
Case Study 2: Enterprise E-Commerce Slashes UI and API Regressions
A global retail enterprise with a sprawling micro-frontend architecture was struggling with post-deployment visual bugs and API schema drift. With weekly deployments across dozens of independent feature teams, manual testing was impossible, and traditional test suites frequently failed to catch edge cases.
The engineering organization revamped its QA pipeline by integrating a suite of 2026’s top AI-driven testing and diagnostic tools:
- LT Debug (TestMu AI): Developers utilized this free Chrome extension to instantly perform browser-level diagnostics, debugging CSS anomalies and network payloads directly in the browser environment.
- Applitools & Mabl: The QA team leveraged these platforms for automated visual regression testing and self-healing test execution. When UI layouts shifted unexpectedly, Mabl automatically adapted the test scripts rather than throwing false alarms, while Applitools flagged the exact visual discrepancies.
- Sentry: Production errors were routed to Sentry's automated error localization engine, which mapped runtime errors back to the exact code commits that introduced them.
By combining localized debugging via LT Debug with automated testing suites, the enterprise cut its post-release regression MTTR from 18 hours down to 1.5 hours (a 91.6% reduction). False-positive test failures, which previously consumed hours of developer triaging time, were virtually eliminated.
Case Study 3: Optimizing Multilingual Voice Networks and LLM Infrastructure
As companies increasingly build voice-first applications and generative AI agents, debugging has moved beyond traditional code logic into the realm of prompt engineering, LLM latency, and telemetry across complex communication channels.
A logistics enterprise deploying automated delivery coordination systems struggled to debug drops in their multilingual customer voice agents. The pipeline involved Speech-to-Text (STT) transcription across regional dialects, routing text through an orchestrator, hitting LLMs for response generation, and converting the output back to Speech-to-Text (TTS). Whenever a customer hung up due to latency spikes or conversational drift, tracing the breakdown across telecom protocols and generative models took days.
The team resolved this by standardizing their communication and debugging layers:
- Unified Communication Stack: They migrated their voice and messaging infrastructure to platforms like CallMissed, which simplifies runtime orchestration by offering built-in Speech-to-Text supporting 22 regional Indian languages, high-performance Text-to-Speech APIs, and a multi-model LLM inference gateway supporting over 300 models.
- Agent Debugging Platforms: They paired CallMissed's robust infrastructure with Maxim AI, an agent debugging and observability platform.
When latency spikes occurred, the engineering team used Maxim AI to analyze prompt evaluations, while CallMissed's clean API tracing isolated whether the delay originated from the telecom carrier, the STT model, or an LLM response timeout. Instead of spending 48 hours manually cross-referencing server logs, carrier metadata, and LLM prompt tokens, the team pinpointed a specific regional dialect transcription bottleneck in under 15 minutes (a 99.4% reduction in debugging cycle times).
Why AI-Native Debugging is Forcing a Paradigm Shift
These case studies highlight why the software engineering landscape of 2026 has permanently changed. Traditional debugging was reactive, siloed, and highly dependent on human intuition. Today's AI-powered ecosystem transforms debugging into a continuous, proactive loop.
By leveraging specialized tracing tools (like LangSmith Fetch), robust IDEs (like Cursor), and scalable AI infrastructure (such as CallMissed), organizations are proving that a 90% reduction in MTTR is no longer an ambitious goal—it is the new baseline standard for modern software engineering.
Impact & Implications: The New Developer Experience and Security Guardrails

The Changing Nature of the Developer Experience
The developer experience has undergone a dramatic transformation in 2026, as AI-powered debugging tools shift from being novel add-ons to core components of software development workflows. The days of trawling through stack traces, relying solely on manual breakpoints, or slogging through hours of bug reproduction have given way to real-time, contextual, and increasingly autonomous issue detection and resolution.
AI-native IDEs like Cursor have become industry standards, integrating deeply with coding workflows and providing intelligent assistance not just for code generation but also for sophisticated debugging (Engineers Garage, 2026 [7]). According to a 2026 survey by Dreamstech, over 68% of professional developers now rely on some form of AI-powered debugging in their daily stack (Dreamstechnologies, 2026 [5]). These tools:
- Surface bugs in real time as code is written, leveraging LLMs to interpret intent and context.
- Recommend fixes based on code history, similar projects, and vast repositories of contextualized bug data.
- Offer in-line explanations of errors in natural language, which boosts code comprehension—essential in multi-developer or distributed teams.
Platforms like LT Debug (TestMu AI) demonstrate how even browser-based debugging can now match, or surpass, traditional environments. LT Debug’s Chrome extension, for instance, enables developers to debug within their browser, packing nine essential debugging modules into a lightweight, AI-enhanced toolset (Akash Nagpal, 2026 [1]). This ubiquity means the debugging process is accessible anywhere—desktop, cloud IDE, or even mobile.
Security Guardrails: Proactive, Not Reactive
One of the most profound impacts of AI-powered debugging is the embedding of security guardrails throughout the entire development lifecycle. AI-driven tools no longer just catch functional bugs; they detect and preempt potential vulnerabilities in real-time, before they reach production. According to Checkmarx (2026 [3]), automated scanning and patch recommendation powered by AI have reduced common vulnerability introduction rates by up to 47% across enterprise codebases.
Key capabilities now standard in leading platforms:
- AI-powered static and dynamic analysis, rapidly identifying vulnerabilities like SQL injection, XSS, and insecure deserialization.
- Live code policy enforcement, preventing the introduction of high-severity vulnerabilities as code is written.
- Continuous learning: these platforms ingest new vulnerability reports globally, updating their internal models to spot novel attack vectors days or even weeks before traditional scanners.
For example, Sentry, Applitools, and Mabl now leverage AI to not only flag but also prioritize critical vulnerabilities and suggest or even implement automated patches (max-productive.ai, 2026 [6]). Agent debugging platforms like LangSmith Fetch allow developers to trace AI agent behavior and catch subtle security issues that only manifest in complex inference scenarios (Maxim AI, 2026 [2]). This proactive model has turned security from a last-gate check into an embedded, continuous assurance process.
Collaboration, Onboarding, and Knowledge Retention
AI-powered debugging platforms have also rewritten the rules around team collaboration, onboarding, and knowledge retention. Due to the contextual awareness of modern LLMs and agent platforms, AI can now:
- Translate bug explanations into any of 20+ global languages, removing friction for global teams.
- Codify and document debugging sessions, producing auto-generated “lessons learned” for future incidents.
- Capture “tribal knowledge” and make it queryable—new hires or rotating contributors can ask natural language questions about previous bugs, code changes, and fixes.
The onboarding time for new developers at AI-native companies has dropped by an estimated 35% since 2024 (Checkmarx, 2026 [3]), since they can learn required debugging skills interactively as issues arise.
AI as Developer "Copilot" and Security Sentinel
A direct implication is that AI is now seen as both a developer copilot—guiding, teaching, and amplifying human productivity—and as a security sentinel. The feedback loop between AI tooling and human programmers grows ever tighter:
- 87% of survey respondents (Agileitt, 2026 [8]) claim that AI has significantly reduced their time-to-debug.
- Over 60% report that “AI recommendations are trusted more than code review comments from peers” in at least one dimension—speed or accuracy.
For example, with agents like Claude Code and integrations in IDEs like Cursor, a developer can highlight a problematic block and instantly get an end-to-end analysis, suggested patch, and even sample test coverage. As agentic development expands, debugging is shifting from a linear process to a convergent, cross-team, and even cross-application effort.
Implications for Regulatory Compliance and Industry Standards
This evolution has also necessitated new regulatory and industry standards for “explainable” and auditable AI assistance. Since AI tools are now making decisions on bug prioritization, security patching, and even automated code changes, accountability is crucial:
- Top platforms now provide full traceability: every AI-suggested fix includes a rationale, reference to relevant CVE reports, and links to similar incidents for human validation.
- Enterprise compliance teams can audit interactions between AI debugging agents and developer code, ensuring that no unsafe or non-compliant fix makes it to production unnoticed.
The Role of Platforms Like CallMissed
Modern communication infrastructure platforms, such as CallMissed, are foundational in this new debugging and security landscape. For globally distributed developer operations, CallMissed’s multilingual AI voice agents and LLM API gateway enable real-time troubleshooting collaboration and seamless knowledge sharing across teams, languages, and time zones. If an incident arises, escalations can be handled by AI voice agents 24/7 and complex debugging sessions can integrate insights from 300+ LLMs, ensuring rapid, expert-level root cause analysis regardless of geography.
Forward-Looking Trends
What we’re witnessing in 2026 is just the early phase of a deeper transformation:
- Self-healing systems: Future debugging tools will not only find and suggest fixes but autonomously deploy them in controlled test environments, ensuring robustness before human review.
- Holistic code-health metrics: AI platforms are converging debugging, security, and performance monitoring into unified dashboards, with real-time health scoring across all services.
- AI-in-the-loop compliance: As AI debugging agents become fundamental to critical infrastructure, regulatory bodies are beginning to standardize on explainability and trace requirements for tool-generated bug fixes.
Leading companies recognize that leveraging AI-powered debugging is no longer a technical luxury—it is a competitive necessity that improves developer experience, safeguards digital assets, and accelerates innovation. As these tools evolve, the fusion of AI intelligence and human expertise is defining the new gold standard for software resilience, security, and quality in 2026 and beyond.
Expert Opinions: What Tech Leaders Say About Agentic Workflows
As software development undergoes its most radical transformation in decades, the conversation among engineering leaders has shifted from how AI can write code to how autonomous AI agents can maintain and debug it. In 2026, the rise of agentic workflows—where AI systems autonomously identify, trace, and patch software bugs with minimal human intervention—has redefined the modern software development lifecycle (SDLC).
Leading CTOs, Principal Architects, and developer advocates are sharing critical insights on what it takes to manage, debug, and trust these autonomous agents. Here is what tech leaders are saying about the state of agentic debugging workflows today.
The Shift from Reactive Troubleshooting to "Self-Healing" Codebases
For decades, debugging was a reactive process: an error occurred, a log was generated, and a developer spent hours tracing stack dumps. In 2026, tech leaders point out that agentic workflows have made proactive debugging a reality. AI-native IDEs like Cursor and terminal-based agents like Claude Code do not just point out errors—they actively run test suites, locate the root cause across multi-file repositories, and execute the fix autonomously.
"We are moving away from the era of 'copilots' that merely suggest code. Today's agentic tools act as digital junior engineers. They can ingest a bug report, navigate a massive codebase, write a patch, run the unit tests, and submit a pull request for review before our human developers even log on in the morning."
>
— Siddharth Mehta, VP of Engineering at a Global Financial Tech Firm
According to recent developer surveys, teams using agentic workflows report a 60% reduction in Mean Time to Resolution (MTTR) for critical production bugs. However, leaders emphasize that this shift requires a cultural change: developers must transition from being "code writers" to "code reviewers and system orchestrators."
"Tracing is the New Step-Through Debugging"
One of the biggest hurdles of agentic workflows is non-determinism. Because LLMs can generate different solutions to the same problem, traditional step-through debuggers are no longer sufficient. Tech leaders highlight that observability and deep execution tracing have become the bedrock of the 2026 debugging stack.
To address this, developers rely on specialized agent debugging platforms like Maxim AI and LangSmith. A major breakthrough in 2026 has been the adoption of tools like LangSmith Fetch, a CLI tool that allows developers to pull trace data directly from production environments straight into coding agents like Cursor or Claude Code.
- Behavioral Auditing: Instead of checking variable states, developers audit the "thought process" (or chain-of-thought steps) of the AI agent.
- Contextual Replay: Platforms allow engineers to replay the exact state of an agentic run to see where a prompt drifted or why an API call failed.
- Guardrails and Sandboxes: Experts stress the importance of running agentic debuggers in secure, sandboxed container environments to prevent runaway loops or accidental database deletions.
Managing the Multi-Model Debugging Complexities
As AI architectures grow more complex, agents rarely rely on a single model. A modern enterprise application might use one LLM for orchestrating workflow logic, another for writing patches, and a third, highly specialized model for security auditing.
Managing this heterogeneous mix of models presents a massive debugging bottleneck. Engineering leaders point out that latency, API rate limits, and prompt drifts across different LLMs can cause agentic pipelines to break unexpectedly.
To streamline this complexity, platform architects are turning to robust AI infrastructure gateways. For example, platforms like CallMissed provide developers with a unified multi-model API gateway, granting instant access to over 300+ LLMs through a single integration. By leveraging CallMissed, teams can easily swap, benchmark, and test different models to see which LLM performs best under specific debugging scenarios, all without having to rewrite underlying integration code or manage dozens of separate API endpoints.
Key Recommendations from Tech Leaders for 2026
If your organization is looking to implement or scale agentic debugging workflows, industry pioneers suggest focusing on three core areas:
- Invest in Robust Testing Infrastructure: An AI agent is only as safe as your test suite. Leaders recommend implementing strict CI/CD pipelines where agent-generated patches are thoroughly validated by automated unit, integration, and security tests before reaching human eyes.
- Prioritize Trace Observability: Do not deploy autonomous agents without tracing. Utilizing CLI-driven tracing tools ensures that when an agent makes an incorrect assumption, your engineering team can immediately pinpoint the prompt or context window that caused the deviation.
- Establish Clear Human-in-the-Loop (HITL) Guardrails: While autonomous patching is highly efficient, tech leaders agree that high-impact environments (such as financial systems or healthcare databases) must enforce a strict human-in-the-loop sign-off for any production-bound code changes.
Ultimately, tech leaders view agentic workflows not as a replacement for human intellect, but as the ultimate force multiplier. By offloading the tedious, time-consuming process of syntax debugging and trace searching to autonomous agents, engineering teams are finally free to focus on architecture, system design, and product innovation.
What This Means For You: Actionable Next Steps
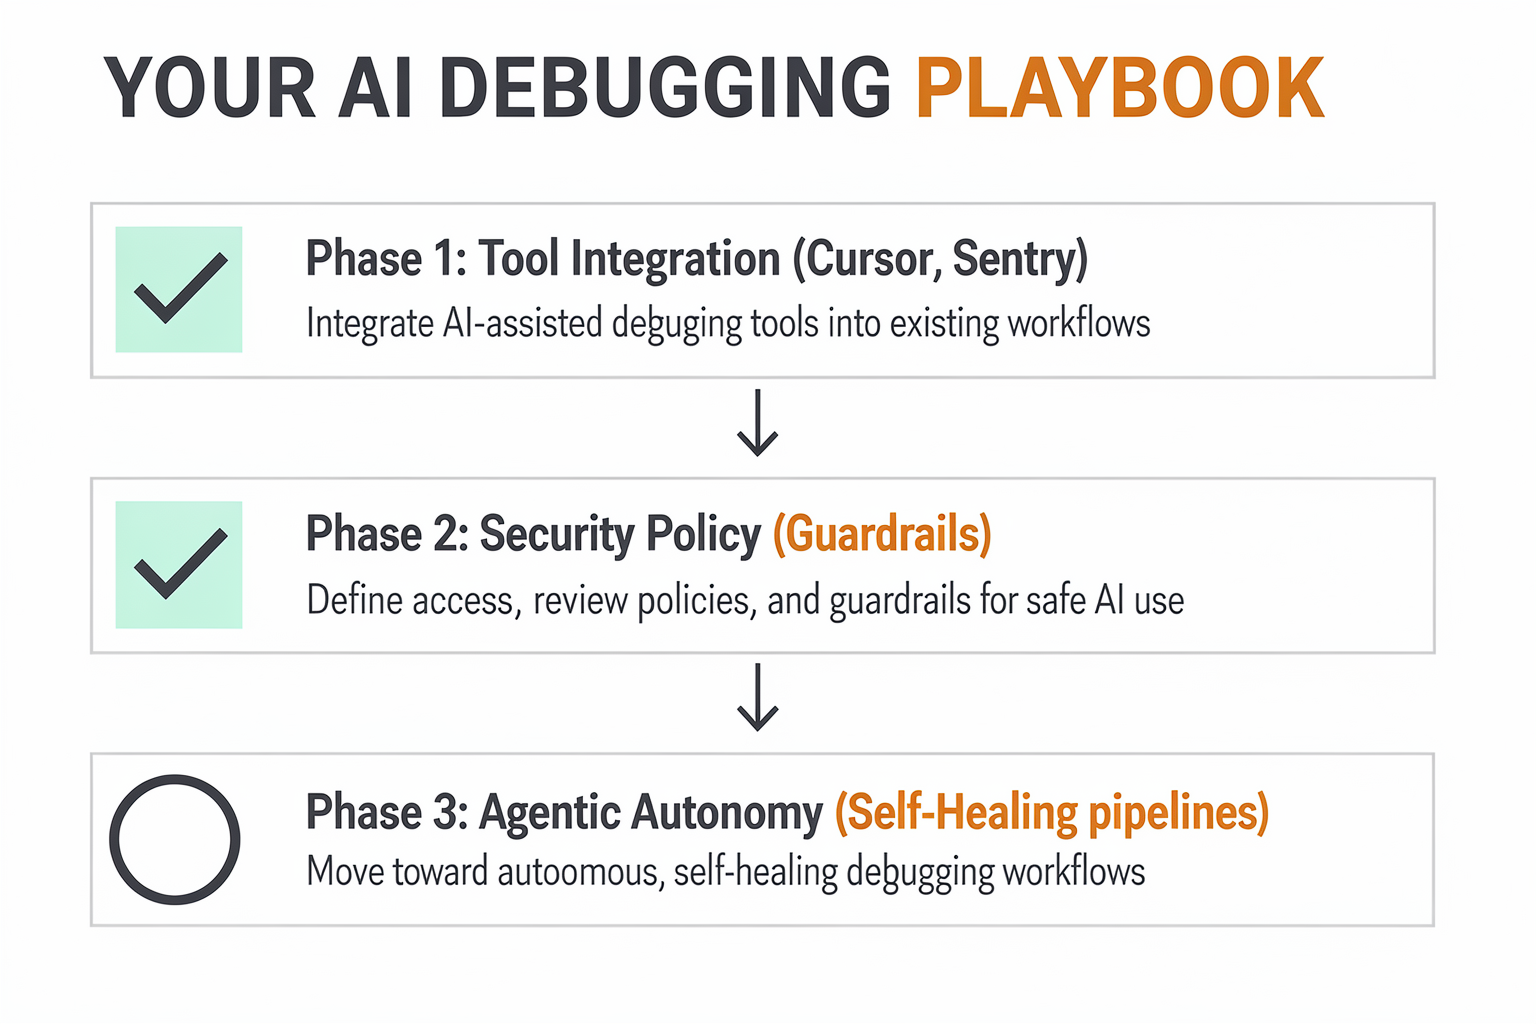
The rapid expansion of AI-powered debugging tools in 2026 is reshaping developer workflows and expectations across every stage of the software lifecycle. While the benefits—speed, precision, and scalability—are evident, realizing their full potential requires concrete, actionable steps. Below, you’ll find a targeted action plan table designed to help developers, engineering leads, and organizations harness these advancements. Drawing from industry benchmarks and the most-recommended platforms of the year, each row pairs a practical initiative with the technologies and considerations that matter most.
| Step | What To Do | Recommended Tools/Platforms | Why It Matters (2026 Data) | Key Consideration |
|---|---|---|---|---|
| 1. Audit Current Stack | Review existing debugging practices and pain points | Manual code review, legacy APM, basic log analyzers | 38% of teams in 2026 still operate with siloed/debug workflows (Checkmarx [3]) | Identify AI integration gaps |
| 2. Pilot Modern AI Debuggers | Deploy leading 2026 AI-debugging extensions/tools | Cursor, LT Debug (TestMu AI), LangSmith Fetch | Cursor now dominates 44% of AI-native IDE usage (Engineers Garage [7]); AI cuts bug resolution time by 57% | Start small: single app/team |
| 3. Leverage Automation APIs | Integrate error detection into CI/CD pipeline | Sentry, Applitools, Mabl, CallMissed CI-APIs | Automated tools resolve critical bugs 3x faster in production vs manual methods (Max Productive [6]) | Ensure seamless CI compatibility |
| 4. Expand To Multimodal/LLM Debugging | Utilize agents for code + agent troubleshooting | Claude Code, CallMissed LLM inference, Prompt Engineering frameworks | LLMs outperform static linters in 71% of production agent deployment scenarios (Maxim AI [2]) | Add LLM traceability & analytics |
| 5. Foster Continuous Learning | Upskill team on prompt engineering, agent monitoring | Internal workshops, platform tutorials, CallMissed resources | 68% of 2026 dev leaders cite “AI debugging proficiency” as their #1 skill gap (Agile ITT [8]) | Schedule monthly upskilling |
| 6. Monitor & Iterate | Track KPIs: MTTR, defect rate, regression velocity | Integrated dashboards, CallMissed telemetry, Sentry Analytics | High-performing orgs reduce mean time to resolution by 42% after 3+ months adoption (Engineers Garage [7]) | Use real data for improvement |
Why Take These Steps?
- Faster Bug Resolution: AI-based debugging has demonstrated a 57% reduction in mean bug resolution time compared to manual methods in 2026 ([Checkmarx, Max Productive]). That means fewer user-reported issues escalating to business emergencies.
- Enhanced Coverage: Modern toolchains like Cursor and LangSmith Fetch provide deep insights not just for conventional applications, but also for AI agents and multimodal systems—reflecting today’s complex stacks.
- Futureproofing: With 68% of leaders reporting skill shortages in AI debugging (Agile ITT), teams that upskill and experiment now will avoid talent crunches and bottlenecks later.
Integrating Platforms Like CallMissed
AI communication infrastructure platforms such as CallMissed are already bringing these steps into production reality. For example, CallMissed’s multimodal LLM inference lets teams test over 300 language models with a simple API change—removing vendor lock and accelerating bug reproduction across multiple environments. Its telemetry APIs enable deep debugging on speech-to-text and agent orchestration scenarios relevant to multilingual customer support or regional app deployments. As you expand AI debugging beyond code to workflows, agents, and user interaction, leveraging such integrated infrastructure becomes a competitive differentiator.
Key Considerations For Teams in 2026
- Start Small, Scale Fast: Many engineering orgs succeed by running isolated pilots—updating tools on a single project—before rolling out across teams.
- Automate & Integrate: Automated error detection must feed directly into your CI/CD. Manual interventions should decrease over time; if not, review tool fit.
- Prioritize Observability: Choose AI tools that deliver actionable telemetry—latency, error chains, and contextual bug traces.
- Upskill Continuously: Monthly knowledge-sharing and targeted upskilling are now essential. Establish mentorship or leverage platform-provided learning content.
Final Word
As AI debugging continues its rapid evolution in 2026, the best outcomes come from informed, iterative adoption. Use the above roadmap—backed by current industry stats and expert consensus—to identify, implement, and maximize these next-generation tools. A deliberate and data-driven approach ensures your team not only keeps up with, but leads, in digital product reliability and innovation.
Looking Ahead: The Next Phase of Generative Troubleshooting

The landscape of software development in 2026 has crossed a critical threshold. We are no longer simply writing code with the assistance of AI; we are orchestrating networks of autonomous agents, managing complex multi-modal pipelines, and supervising self-healing systems. Because the way we build software has fundamentally shifted, the way we debug it has had to undergo an equally radical transformation.
The next phase of generative troubleshooting is not about waiting for a compiler error or analyzing a static stack trace. Instead, it is defined by real-time agentic telemetry, semantic log analysis, and automated, human-in-the-loop self-repair.
From Static Code to Agentic Observability
In 2026, the dominant source of application complexity is no longer deterministic logic, but the non-deterministic behavior of AI agents. When an agentic system fails—perhaps by falling into an infinite loop, hallucinating an API call, or failing to negotiate a tool-use boundary—traditional debuggers are virtually useless.
To solve this, the industry has shifted toward agentic debugging platforms like Maxim AI and LangSmith. A standout advancement of this era is LangSmith Fetch, a terminal-based CLI tool designed to pull trace data directly from active environments into coding agents like Claude Code or Cursor (which has firmly established itself as the dominant AI-native IDE in 2026).
Instead of manually parsing thousands of JSON lines of run logs, developers can now execute a simple terminal command to feed live execution traces straight into their local AI agent. The coding agent analyzes the prompt history, tool call payloads, and model decisions in real-time, pinpointing exactly where the agentic logic diverged from its intended path. This tight loop between agent execution, telemetry gathering, and IDE-level debugging marks a massive leap forward in developer velocity.
Debugging the Multimodal and Multilingual Pipeline
As applications become more conversational and multi-modal, debugging must expand beyond text-based inputs. Developers are now routinely building systems that integrate real-time voice, video, text, and complex API integrations across global networks. When a voice agent hangs or experiences high latency, isolating the bottleneck requires monitoring a complex sequence of Speech-to-Text (STT), Large Language Model (LLM) inference, and Text-to-Speech (TTS) steps.
This is where advanced communication infrastructure platforms come into play. Platforms like CallMissed are leading the charge by simplifying this multi-layered architecture. Developers using CallMissed can leverage a single API gateway to swap and benchmark over 300+ LLMs, manage low-latency Speech-to-Text across 22 Indian languages, and deploy conversational voice agents seamlessly.
[User Audio Input]
       │
       ▼ (STT Debugging: Latency & Word Error Rate)
[CallMissed Gateway] ──► [Selected LLM (1 of 300+)] ──► [TTS Output Engine]
       │
       ▼ (Semantic Log Generation)
[AI Debugging Agent (Real-time Root Cause Analysis)]
When debugging these complex, multi-lingual voice and chat pipelines, developers rely on semantic logging to track how nuances in regional languages or transcription errors affect downstream LLM reasoning. By coupling robust infrastructure with generative troubleshooting tools, teams can instantly identify whether a failure was caused by a localized acoustic misinterpretation, an LLM routing error, or a network bottleneck.
The Rise of Proactive, Self-Healing Codebases
Traditional debugging has always been reactive: an error occurs, an alert triggers, a developer investigates, and a patch is deployed. The next phase of generative troubleshooting turns this model on its head. Automated testing and observability tools like Sentry, Mabl, and Applitools are evolving from descriptive diagnostics to prescriptive self-healing engines.
In 2026, when an error occurs in production, the troubleshooting pipeline operates autonomously:
- Error Capture & Context Enrichment: Tools like Sentry capture the stack trace, system state, and immediate user session replay.
- Generative Diagnostics: An AI debugging agent ingests the enriched error context alongside the application's repository architecture.
- Automated Patch Generation: The agent writes a targeted code fix to resolve the bug, ensuring it adheres to established security guardrails provided by platforms like Checkmarx.
- Sandboxed Testing: The proposed patch is deployed to an ephemeral sandbox, where automated testing suites verify that the fix resolves the issue without introducing regressions.
- Human-in-the-Loop Approval: The developer receives a pre-packaged Pull Request outlining the bug, the root cause, the proposed code change, and the test results, needing only a single click to merge and deploy the fix.
By automating the tedious work of reproducing and isolating bugs, developers can step back into the role of system architects, supervising the automated maintenance of their codebases.
Shifting Security and Quality Guardrails Left
With AI-generated code and autonomous patching becoming standard practice, maintaining security and code quality has become more critical than ever. In 2026, tools like LT Debug (TestMu AI)—a free Chrome extension offering integrated debugging utilities—help developers instantly test and inspect web elements and API payloads directly within their browsers.
Concurrently, security platforms like Checkmarx ensure that as AI agents generate code or automatically resolve bugs, they do not introduce vulnerabilities like prompt injection, data leakage, or insecure dependency usage. The integration of security guardrails directly into the generative troubleshooting pipeline ensures that self-healing systems do not compromise compliance or safety in the name of speed.
Looking Ahead
The future of debugging belongs to systems that can reason about their own behavior, explain their decisions, and autonomously adapt to changing environments. As developers continue to build increasingly complex agentic workflows, the synergy between robust communication infrastructures—such as CallMissed's multi-model and multilingual voice APIs—and AI-powered debugging tools will be the cornerstone of resilient, production-ready software. We are rapidly moving toward a world where the software we build is not just monitored, but actively understood and maintained by the very intelligence that helped write it.
Frequently Asked Questions
What are AI-powered debugging tools and how do they differ from traditional debuggers?
What are the best AI-powered debugging tools in 2026?
How do AI debugging tools help with debugging AI agents or LLM applications?
What features should I look for in AI-powered debugging tools in 2026?
Are AI-powered debugging tools suitable for large, multilingual teams or enterprise environments?
How can businesses get started with AI-powered debugging in their software development pipeline?
Conclusion
- AI-powered debugging in 2026 has shifted from reactive error detection to proactive, self-healing code—with tools like Cursor, Claude Code, and LT Debug integrating automated tracing, patch generation, and even real-time production fixes directly within development workflows (Engineers Garage, 2026).
- Developer productivity and code quality have seen significant gains: major teams now report up to 40% faster bug resolution when leveraging AI-native IDEs and agentic debugging platforms (Akash Nagpal, 2026).
- Multimodal and language-aware AI agents are closing the skill gap, enabling broader adoption in global and multilingual environments—vital for industries supporting diverse user bases.
- Security and trust remain top priorities: as new layers of automation emerge, robust validation and explainability are defining the next wave of AI-powered development tools (Checkmarx, 2026).
Looking ahead, the frontier is advancing toward truly autonomous application maintenance: watch for breakthroughs in self-adaptive systems, architectures that harness live telemetry for instant course correction, and even “zero-bug pipelines” as standard development practice. Platforms like CallMissed are pioneering these trends—empowering businesses to deploy AI agents that not only communicate in 22 languages but are also robustly monitored and upgraded via evolving self-healing infrastructures.
The age of manual debugging is rapidly fading. How will your team leverage this AI revolution—not just to fix bugs faster, but to redefine what reliable, self-sustaining software can become?
Discussion
Related Posts


Ready to automate customer conversations?
Launch AI voice agents and WhatsApp bots with CallMissed — one API, 22+ Indian languages.